Chart of the Day: Big Beat in Non-Farm Payrolls
The Closer — County Employment, National Debt — 3/8/18
Log-in here if you’re a member with access to the Closer.
Looking for deeper insight on markets? In tonight’s Closer sent to Bespoke Institutional clients, we review the Fed’s Flow of Funds report and quarterly data on county business establishments, employment, and wages.

See today’s post-market Closer and everything else Bespoke publishes by starting a 14-day free trial to Bespoke Institutional today!
Bespoke’s Sector Snapshot — 3/8/18
We’ve just released our weekly Sector Snapshot report (see a sample here) for Bespoke Premium and Bespoke Institutional members. Please log-in here to view the report if you’re already a member. If you’re not yet a subscriber and would like to see the report, please start a two-week free trial to Bespoke Premium now.
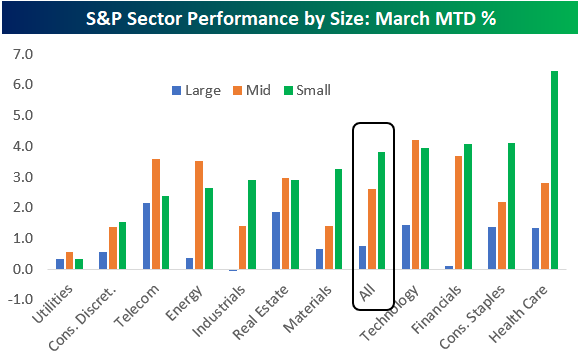
Below is one of the many charts included in this week’s Sector Snapshot, which highlights the month-to-date percentage change of S&P sectors based on market cap. As you can see, small caps have significantly outperformed large caps so far this month.
To see our full Sector Snapshot with additional commentary plus six pages of charts that include analysis of valuations, breadth, technicals, and relative strength, start a two-week free trial to our Bespoke Premium package now. Here’s a breakdown of the products you’ll receive.
Bespoke’s Consumer Pulse Report — March 2018
Bespoke’s Consumer Pulse Report is an analysis of a huge consumer survey that we run each month. Our goal with this survey is to track trends across the economic and financial landscape in the US. Using the results from our proprietary monthly survey, we dissect and analyze all of the data and publish the Consumer Pulse Report, which we sell access to on a subscription basis. Sign up for a 30-day free trial to our Bespoke Consumer Pulse subscription service. With a trial, you’ll get coverage of consumer electronics, social media, streaming media, retail, autos, and much more. The report also has numerous proprietary US economic data points that are extremely timely and useful for investors.
We’ve just released our most recent monthly report to Pulse subscribers, and the results from this month’s survey showed noticeable weakness on both a month-over-month and year-over-year basis. Investor sentiment towards the stock market also took a big dip, which is unsurprising given that the S&P experienced its first 10% correction in two years in February. Start a 30-day free trial for a full breakdown of all of our proprietary Pulse economic indicators.

B.I.G. Tips – February Employment Report Preview
Heading into Friday’s Non Farm Payrolls (NFP) report for February, economists are expecting an increase in payrolls of 205K, which would be a slight increase from January’s reading of 200K. In the private sector, economists are also expecting the same increase of 205K. With these increases, the unemployment rate is expected to fall to 4.0%. The big area of focus, however, will come from average hourly earnings. You may recall that in last month’s report, we saw a larger than expected increase, and that helped to exacerbate what was at the time a modest sell-off in equity prices. With that in mind, look for any signs of strength in wages to have an adverse impact on stock prices.

Ahead of the report, we just published our eleven-page monthly preview of the February jobs report. This report contains a ton of analysis related to how the equity market has historically reacted to the monthly jobs report, as well as how secondary employment-related indicators we track looked in February. We also include a breakdown of how the initial reading for February typically comes in relative to expectations and how that ranks versus other months.
One topic we cover in each month’s report is the S&P 500 stocks that do best and worst from the open to close on the day of the employment report based on whether or not the report comes in stronger or weaker than expected. In other words, which stocks should you buy, and which should you avoid? The table below highlights the best-performing stocks in the S&P 500 from the open to close on days when the Non-Farm Payrolls report has been weaker than expected over the last two years.
When the NFP report is weaker than expected, all of the 25 best-performing stocks in the S&P 500 have seen average open-close gains of more than 1%. NRG Energy (NRG) is the best performing stock in the S&P 500 with an average gain of 1.9% and gains 85% of the time. In terms of consistency, it doesn’t get any better than Sysco (SYY) which has been up from the open to close every time the NFP report has been weaker than expected.
For anyone with more than a passing interest in how equities are impacted by economic data, this report is a must-read. To see the report, sign up for a monthly Bespoke Premium membership now!

the Bespoke 50 — 3/8/18
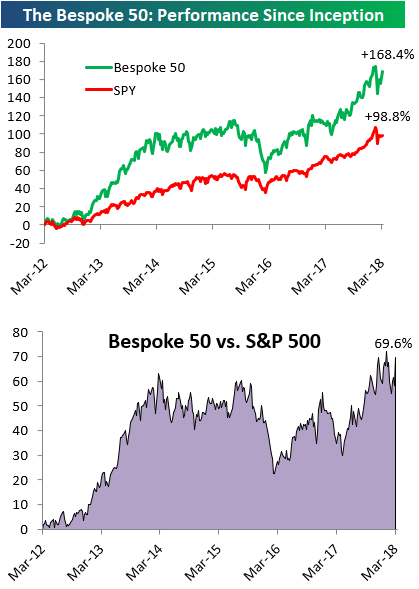
Every Thursday, Bespoke publishes its “Bespoke 50” list of top growth stocks in the Russell 3,000. Our “Bespoke 50” portfolio is made up of the 50 stocks that fit a proprietary growth screen that we created a number of years ago. Since inception in early 2012, the “Bespoke 50” has beaten the S&P 500 by 69.6 percentage points. Through today, the “Bespoke 50” is up 168.4% since inception versus the S&P 500’s gain of 98.8%. Always remember, though, that past performance is no guarantee of future returns.
To view our “Bespoke 50” list of top growth stocks, click the button below and start a trial to either Bespoke Premium or Bespoke Institutional.
FANG+
One of the first lessons of any marketing class is that adding a “+” next to any product automatically infers that the new version is a better version of the old one. So, while FANG was an adequate group of stocks for investors looking to get their fix of the most turbo-charged growth stocks, like every trend or fad, eventually the idea gets stale and consumers need more. So what was a financial marketer to do? Why not take FANG and ad a plus sign!
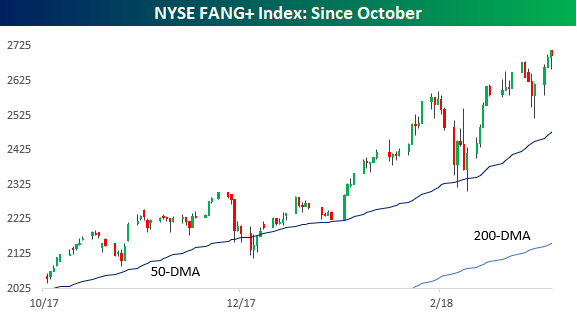
Enter FANG+. While FANG was simply a combination of Facebook (FB), Amazon (AMZN), Netflix (NFLX), and Alphabet (GOOGL), FANG+ takes those four names and adds in other favorites of the action-seeking trading community like Apple (AAPL), Alibaba (BABA), Baidu (BIDU), NVIDIA (NVDA), Tesla (TSLA), and Twitter (TWTR). Talk about a hyper-growth investor’s dream! Taking a look at the performance of FANG+ since its inception late last year, the index has been on quite a tear with a gain of over 34% since late October.
We ran the members of FANG+ through our Trend Analyzer tool– which is available to Premium and Institutional members — in order to see how these names stack up and how they’ve performed so far this year. Needless to say, it’s been quite a run. In spite of the fact that the broader market is up just slightly on the year, every stock in the FANG+ index is outperforming the S&P 500, and four of the stocks are outperforming by a magnitude of more than 10 times! Leading the way, Netflix (NFLX) is up 64%, Twitter (TWTR) is up 47%, and Amazon.com (AMZN) is up over 30%. Given these moves, it should come as no surprise that all three stocks are overbought. The remaining stocks in the index are all in neutral territory, and only one (TSLA) is below its 50-day moving average (DMA). NVDA, GOOGL, and AAPL even have good timing scores. Shares of Facebook (FB) and Apple (AAPL) are both up less than 5%, though, so these two better get their act together!
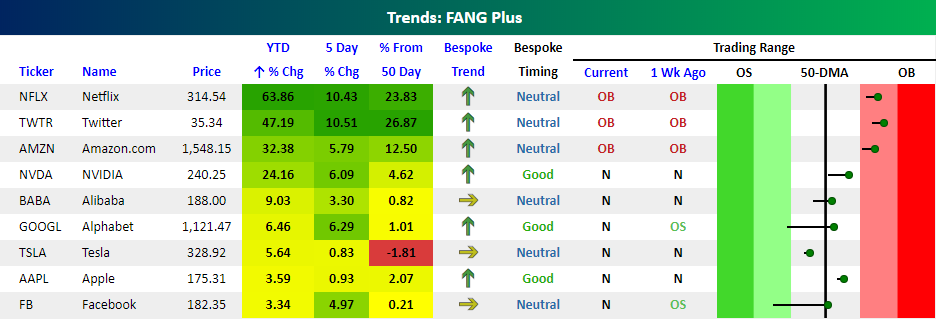
Chart of the Day: Va-Va-Veritiv
Jobless Claims Jump
Jobless claims for the latest week increased by 21K, which is the largest one-week increase since late last Summer when Hurricane Harvey struck Texas. What’s still pretty amazing is that even after the increase, claims only amounted to 231K, which in any other period over the last several years would have been considered an extraordinarily low reading. Jobless claims have now been below 250K for eight straight weeks and below 300K for 157 weeks in a row.
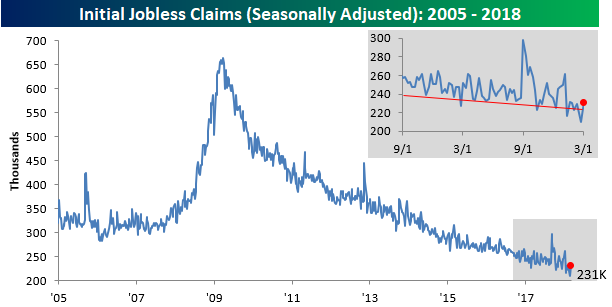
After hitting a multi-decade low last week, the four-week moving average increased slightly to 222.5K from 220.5K last week.

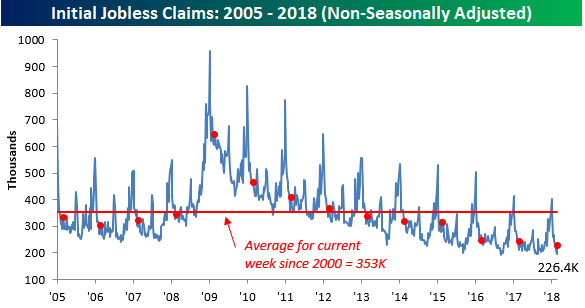
On a non-seasonally adjusted (NSA) basis, jobless claims increased by 30.5K. Even with the increase, though, this week’s reading was well below the average of 353K for the current week of the year dating back to 2000. To find a week at this time of year where NSA claims were lower, you have to go back to 1969.
Running of the Bulls (From Stocks)
It really didn’t take much for the individual investor to sour on equities. After nearly three years where bulls failed to gain a majority in the weekly sentiment survey from AAII, in late December of last year, bullish sentiment finally topped 50% and reached as high 59.75% in early January. Then the correction came. After the swoon in equities in late January/early February, sentiment remained surprisingly resilient at just under 50% in mid-February. As the initial bounce off the February lows lost momentum and volatility continued, individual investors have had enough and are quickly jumping off the bullish bandwagon.
In this week’s sentiment survey from AAII, bullish sentiment plummetted nearly 11 percentage points, falling from 37.28% down to 26.4%. That’s the lowest weekly reading since the end of August and the largest two-week decline since June 2013.

While investors have been exiting the bullish camp, bearish sentiment hasn’t seen much of a bounce. At 28.38%, it is slightly higher than bullish sentiment, but it has been higher as recently as early February.

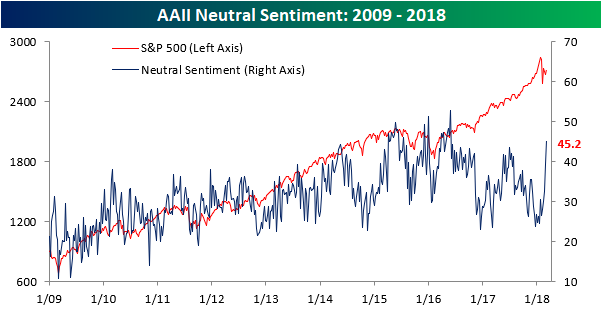
Neutral is where it’s at these days. In this week’s survey, the non-committal camp increased from 39.3% up to 45.2%. That’s the highest weekly reading since May 2016 and the largest two-week increase since December 2015.