Bespoke’s Global Macro Dashboard — 4/4/18
Bespoke’s Global Macro Dashboard is a high-level summary of 22 major economies from around the world. For each country, we provide charts of local equity market prices, relative performance versus global equities, price to earnings ratios, dividend yields, economic growth, unemployment, retail sales and industrial production growth, inflation, money supply, spot FX performance versus the dollar, policy rate, and ten year local government bond yield interest rates. The report is intended as a tool for both reference and idea generation. It’s clients’ first stop for basic background info on how a given economy is performing, and what issues are driving the narrative for that economy. The dashboard helps you get up to speed on and keep track of the basics for the most important economies around the world, informing starting points for further research and risk management. It’s published weekly every Wednesday at the Bespoke Institutional membership level.
You can access our Global Macro Dashboard by starting a 14-day free trial to Bespoke Institutional now!

The Closer — Last 90 Minutes, Brazilian Growth, Auto Sales Spike — 4/3/18
Log-in here if you’re a member with access to the Closer.
Looking for deeper insight on markets? In tonight’s Closer sent to Bespoke Institutional clients, we review how predictive end-of-day trading is to longer-term returns, Brazilian economic data released today, and the strong March auto sales number.

See today’s post-market Closer and everything else Bespoke publishes by starting a 14-day free trial to Bespoke Institutional today!
B.I.G. Tips – Global PMIs Slow
Chart of the Day: Taking Consumers’ Pulse
Bespoke Stock Scores — 4/3/18
1% Swings Surge
While the S&P 500 futures market occupied a relatively narrow range overnight, now that the US is trading there have been some more big swings intraday. After trading up at the open, stocks lost almost 1% through mid-morning lows. They then rallied more than 1.1% and have since pulled back again. That kind of intraday volatility is also met with closing price volatility. The VIX has been around 20 over the past few weeks, and we’ve been seeing a lot more 1% swings. In the chart below, we show the share of days where the S&P 500 either fell or rose by 1% over the past 3 months. From December 8th to January 25th, that rolling 3 month measure was zero…not a single 1% day! Over the last few months, though, the share of 1% days has rocketed higher. Currently, 38% of trading days over the past 3 months have been 1% moves. Only periods of volatility right at the start of the bull market, early 2010, mid 2011, and early 2016 saw higher shares of days with 1% or greater moves.
Start a free trial to Bespoke Premium to begin receiving our premium market analysis now.
Bullish April Seasonality Not Until Second Half of Month
April has historically been one of the strongest months of the year for the stock market. Recently, though, the gains have all come in the second half of the month once Tax Day (April 15th) passes.
You can clearly identify this trend using our Stock Seasonality tool, which is available to Bespoke Premium and Bespoke Institutional clients.
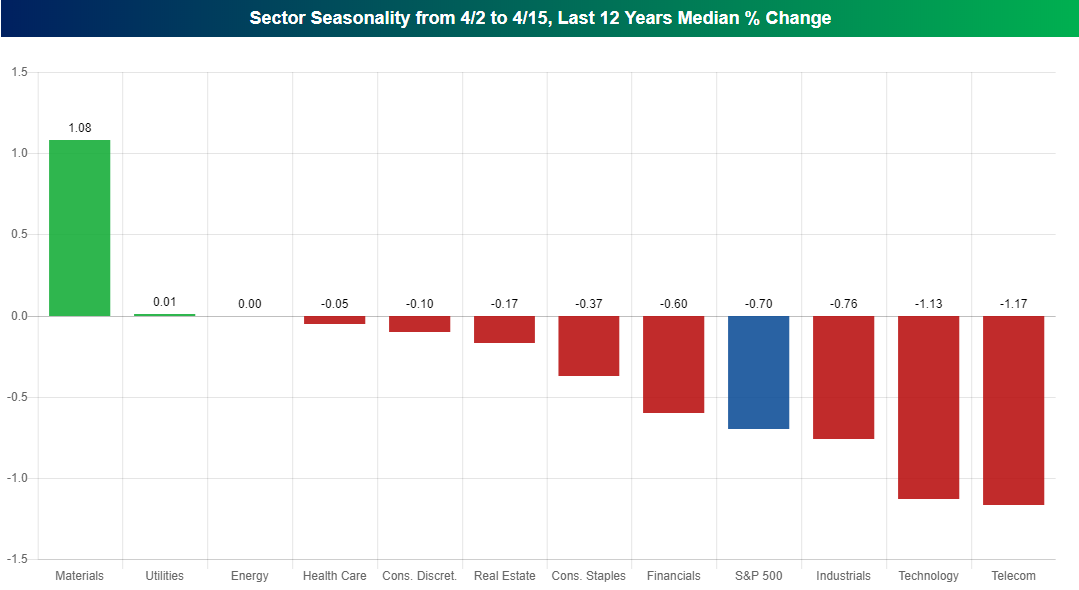
We ran a screen to find the median change of S&P 500 sectors over the last 12 years from April 2nd through April 15th, which generated the chart below. As shown, the S&P 500 has seen a median decline of 0.70% during this time frame, while just two of eleven sectors have posted median gains.
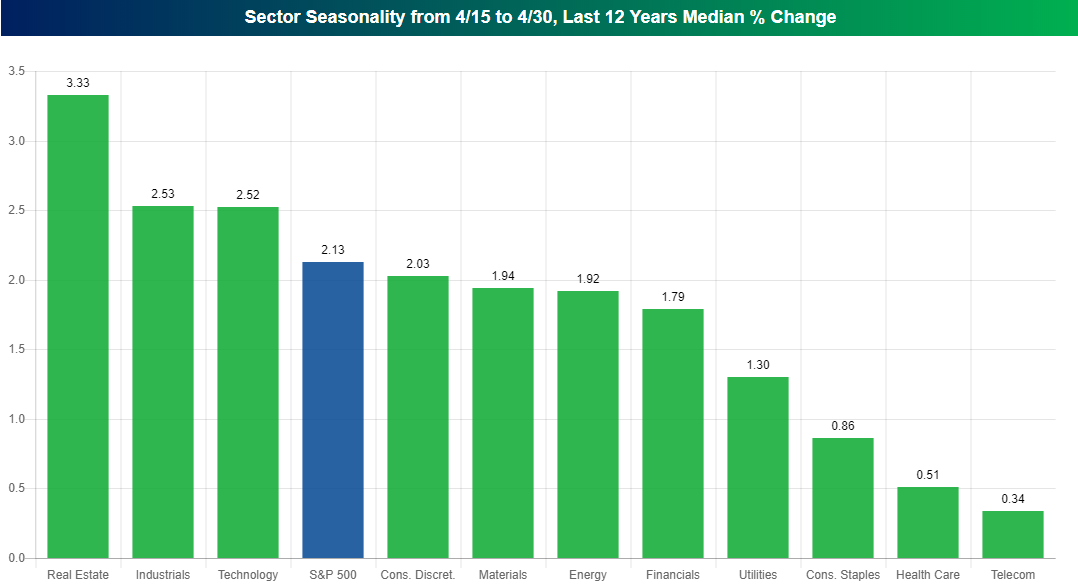
When we run the same screen but look at the period from April 15th through April 30th, the chart below shows that the S&P 500 has seen a median change of +2.13%. All eleven sectors have posted median gains, and four sectors have gained more than 2% (Cons. Discret., Tech, Industrials, and Real Estate).
Clearly the back half of April has been much stronger than the front half in recent years.
Start using our Stock Seasonality Tool now with a free trial to Bespoke Premium or Bespoke Institutional.
The Closer — Bloody Mondays — 4/2/18
Log-in here if you’re a member with access to the Closer.
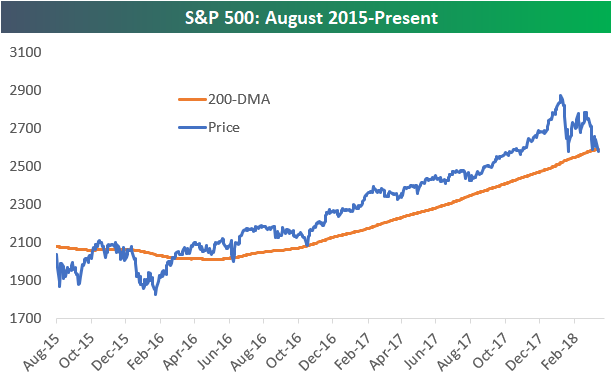
Looking for deeper insight on markets? In tonight’s Closer sent to Bespoke Institutional clients, we look at today’s break below the 200-day moving average for the S&P 500. Prior to today, the S&P had closed above its 200-DMA for the past 442 trading days! How does the index normally trade in the days and weeks following a break below the 200-DMA? We answer that question and more in the report.
See today’s post-market Closer and everything else Bespoke publishes by starting a 14-day free trial to Bespoke Institutional today!
Chart of the Day: April Showers
First Quarter 2018 Asset Class Performance (ETF Matrix)
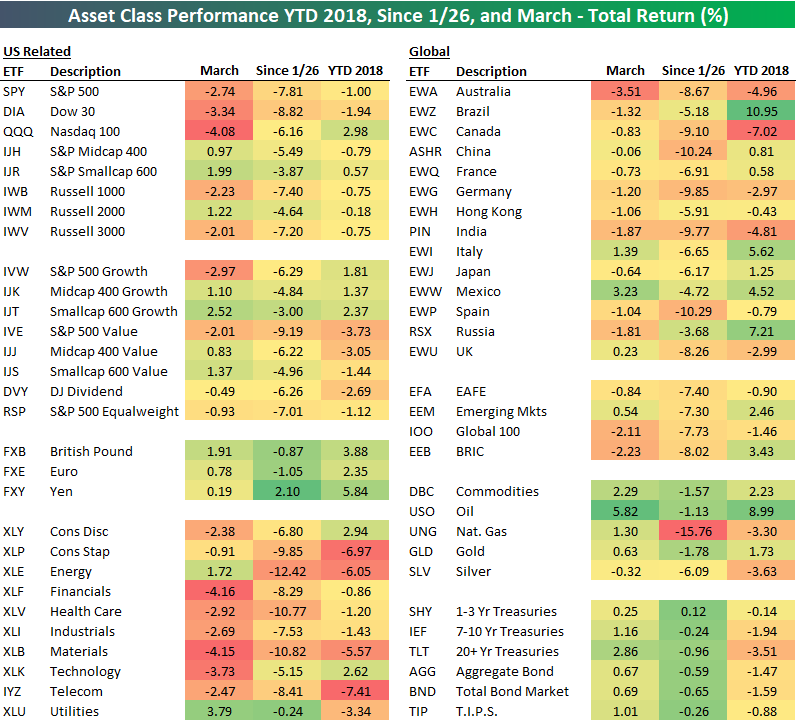
With the first quarter of 2018 now behind us, below is a full rundown of asset class performance during the quarter. For each ETF in the matrix, we also include its performance in March as well as since the 1/26 high for the S&P 500.
As shown, the S&P 500 (SPY), Dow 30 (DIA), and Nasdaq 100 (QQQ) all fell quite significantly in March, which was enough to drag both the S&P 500 and Dow 30 into negative territory for the quarter. For the S&P 500, Q1 2018 was the first down quarter since Q3 2015, and it was the first down first quarter since Q1 2009.
While large caps got hit in March, smallcaps and midcaps actually posted solid gains. Looking at S&P 500 sectors, the worst performing areas in March were Financials, Materials, and Technology, while Energy and Utilities were actually up nicely. For the full first quarter, though, Technology and Consumer Discretionary were the only two sectors in the black.
Outside of the US, Canada was down the most in Q1, while Brazil was up the most. Commodities generally did well in Q1 with the exception of natural gas and silver, while Treasury ETFs fell across the board (as interest rates rose).
Start a free trial to Bespoke Premium to begin receiving our premium market analysis now.