ISM Non Manufacturing Remains Right Near Multi-Year Highs
After climbing to a twelve-year high in January, the ISM Non-Manufacturing report dipped a bit in February but still managed to beat expectations. While economists were forecasting the headline index to fall from 59.9 down to 59.0, the actual decline was less than half of that to 59.5. Outside of last month’s report and the one in October 2017, this month’s would have been the best reading since August 2005. On a combined basis, accounting for each sector’s share of the overall economy, the February ISM came in at 59.6, which was a slight decline from January, but still right near multi-year highs.
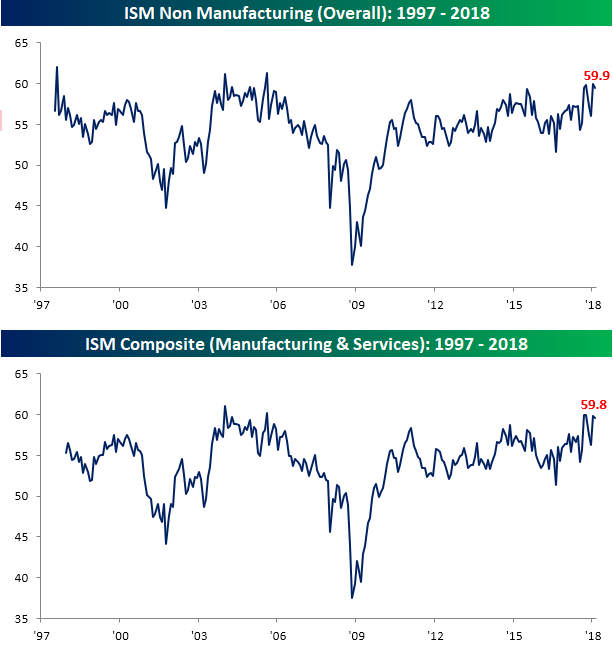
As far as the internals of the report were concerned, it was also a pretty solid report. On both a m/m and y/y basis, more sub-indices were up than down. New Orders were particularly strong as that index rose to its highest levels since January 2006. On the downside, the Employment component saw its largest m/m decline since February 2014. While that doesn’t bode particularly well for Friday’s Non-Farm Payrolls report, we would note that in January the index had a pretty big jump, so this month’s pullback is probably just a reversion to the mean type of move. Furthermore, back in February 2014 when we last saw a similar one-month decline, the corresponding Non-Farm Payrolls report actually came in stronger than expected. One encouraging aspect of the report was the Prices Paid component, which actually showed a slight decline relative to January.

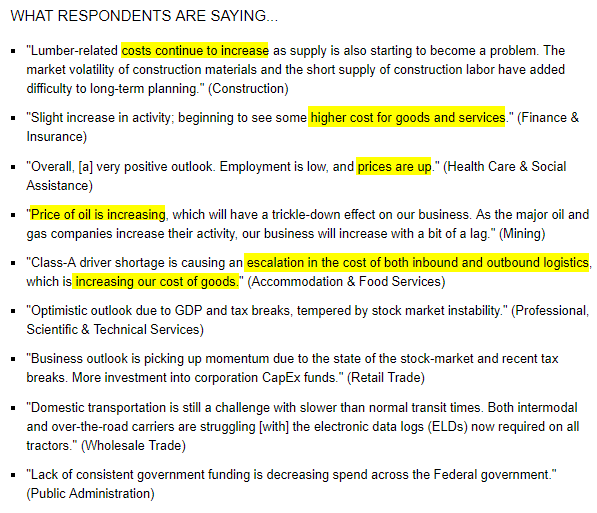
While the Prices Paid component of this month’s report declined, like the ISM Manufacturing report last week, there are still plenty of whiffs of inflation in it. As shown below, in the commentary section of this month’s report, there were still more than a couple of mentions of rising prices and higher costs.
Bespoke Brunch Reads: 3/4/18
Welcome to Bespoke Brunch Reads — a linkfest of the favorite things we read over the past week. The links are mostly market related, but there are some other interesting subjects covered as well. We hope you enjoy the food for thought as a supplement to the research we provide you during the week.
Economics
When the Story Changes, Be Alert by Bill McBride (Calculated Risk)
A compelling case that the generally stable US economic backdrop is shifting somewhat after years of catalyst free recovery from the last recession. [Link]
Why governments have overestimated the economic returns of higher education (The Economist)
Historically workers with degrees have earned a substantial wage premium, but there’s some evidence that this won’t be true in the future and investments in education are overrated. [Link]
Dystopia
Palantir Has Secretly Been Using New Orleans To Test Its Predictive Policing Technology by Ali Winston (The Verge)
The New Orleans Police Department is using algorithms which draw data from criminal records, ties to other gang members, and social media to predict criminal behavior; but that predictive policing approach isn’t disclosed to defendants as part of their trials. [Link]
Live by the algorithm, die by the algorithm: How LittleThings went from social publishing darling to shutting down by Luicia Moses (Digiday)
Small tweaks to algorithms can have huge real-world consequences for publishing companies and consumers of media. [Link]
Big Tech
Why We May Soon Be Living in Alexa’s World by Farhad Manjoo (NYT)
A review of how embedded Alexa is becoming in households and lives, with sales running in the tens of millions for the sprawling universe of voice-activated devices. [Link; soft paywall]
Checking in With Alphabet Chair John Hennessy by Tekla S. Perry (IEEE Spectrum)
Unsurprisingly, Hennessy thinks “it’s not technology that has created the rifts in our communities”, and that focus on doing the right thing at Google is “more than just avoiding evil”. [Link]
New Approaches
By mass-texting local residents, Outlier Media connects low-income news consumers to useful, personalized data by Christine Schmidt (Nieman Lab)
A Detroit media company is taking “service journalism” to new heights, but aiming at lower income citizens. The new model reads very, very differently from new digital journalism offerings that have sprouted up over the last few years. [Link]
Real Estate
Rising mortgage rates hit new home sales hard, an ominous sign for builders by Diana Olick (CNBC)
Low inventories, high prices, and now rising mortgage rates have made the outlook for new home sales activity less positive than it was a relatively short time ago. [Link; auto-playing video]
Equality
Tammy Duckworth faces predicament in Senate over maternity leave by Emily Tillett (CBS)
Illinois Senator Duckworth is due in April and will become the first sitting US Senator to give birth when her new daughter arrives. In the stuffy world of the US Senate, where children aren’t allowed on the floor and maternity leave doesn’t exist, that will create some issues. [Link; auto-playing video]
Report: No progress for African Americans on homeownership, unemployment and incarceration in 50 years by Tracy Jan (WaPo)
Higher unemployment, lower homeownership, much higher incarceration rates, much less wealth, lower income at similar levels of education and age, and little progress on all of these headwinds are a brutal laundry list of policy failure when it comes to the African American community. [Link; soft paywall]
Consumer Nightmares
How Defective Guns Became the Only Product That Can’t Be Recalled by Michael Smith and Polly Mosendz (Bloomberg)
What happens when a gun doesn’t work the way it’s supposed to? Unlike other products, basic consumer protections like recalls are simply not an option, and that can have deadly consequences. [Link]
Crypto
Cryptocurrency Firms Targeted in SEC Probe by Jean Eaglesham and Paul Vigna (WSJ)
This week the SEC issued dozens of subpoenas and requests for information to companies that had issued cryptocurrencies or tokens, in a sweeping regulatory action that moves to bring the space into compliance with US law by hook or by crook. [Link; paywall]
History
The Economics of the Civil War by Roger L. Ransom (EH.net)
A data-intensive review of the causes, consequences, and costs of the Civil War from an economic perspective. [Link]
Tangled Webs
HNA via GAR? The mystery of Deutsche Bank’s largest shareholder by Robert Smith (FTAV)
Answering the question “Who owns the biggest chunk of Germany’s largest bank” is anything but straightforward. [Link; registration required]
High Yield
Marxism Has Cornered the Junk-Bond Market by Jim Bianco (Bloomberg View)
A rising share of the corporate bond market is captured in passive flows from ETFs and other index vehicles, presenting challenges for the market. [Link]
Health Care
What might the Amazon, Berkshire and JP Morgan health care joint venture actually do? by Tren Griffin (25iq)
Speculation on what might be in store for the non-profit joint venture between three of the largest American corporations. [Link]
Star Wars
We Dare You To Explain Luke’s Plan To Rescue Han In ‘Return of the Jedi’ by Mike Ryan (Uproxx)
Even if things went well, which they did not, Luke’s plan to get Han back from Jabba the Hutt was a complete non-starter, with nonsensical goals, terrible strategy, and absurdly bad execution. [Link]
Read Bespoke’s most actionable market research by starting a two-week free trial today! Get started here.
Have a great Sunday!
The Bespoke Report — “Paddles!” — 3/2/18
The Closer: End of Week Charts — 3/2/18
Looking for deeper insight on global markets and economics? In tonight’s Closer sent to Bespoke clients, we recap weekly price action in major asset classes, update economic surprise index data for major economies, chart the weekly Commitment of Traders report from the CFTC, and provide our normal nightly update on ETF performance, volume and price movers, and the Bespoke Market Timing Model. This week, we’ve added a section that helps break down momentum in developed market foreign exchange crosses.

The Closer is one of our most popular reports, and you can sign up for a free trial below to see it!
See tonight’s Closer by starting a two-week free trial to Bespoke Institutional now!
S&P 500 Quick-View Chart Book — 3/2/18
Speculators Unload Crude
Oil prices have bounced back a lot, despite recent softer price action that sees crude near $60. That’s put near-month crude at a hefty premium to out-months, a so-called backwardation of the WTI curve. As shown in the chart below, the ~10% premium for front-month over year-ahead crude is about as high as it’s gotten over the past decade or so. The price differential provides a huge incentive for investors to supply crude to the market by selling spot crude and buying out-months. That creates a positive yield. The opposite was true in the period when the WTI curve was in contango; investors had an incentive to buy spot and sell out-months, driving up inventories. As shown in the chart below, while inventories and the shape of the crude curve are not perfectly correlated, they’ve got a very close relationship. As long as out-months remain at a discount to the front of the curve, don’t be surprised to see global stockpiles continue to shrink.

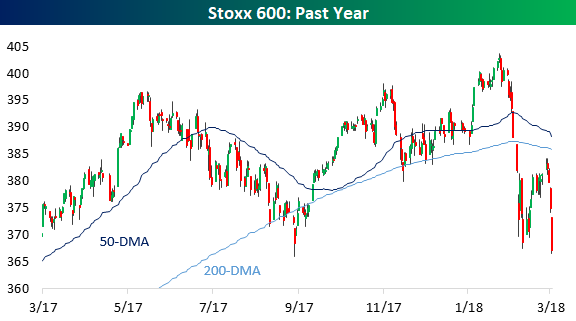
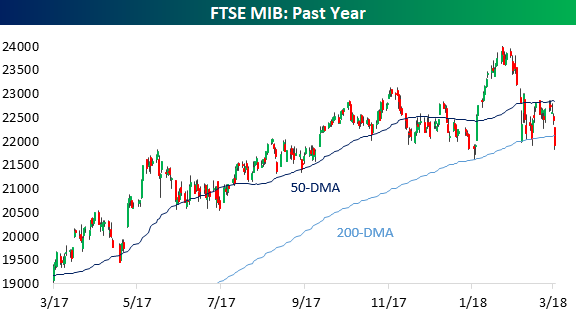
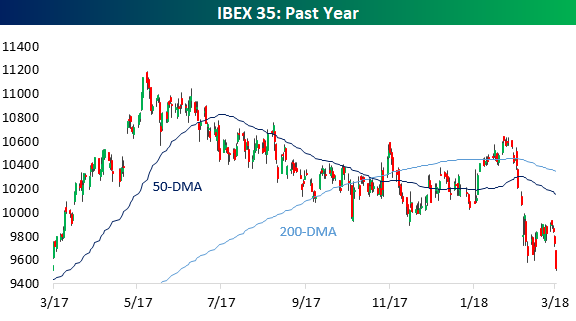
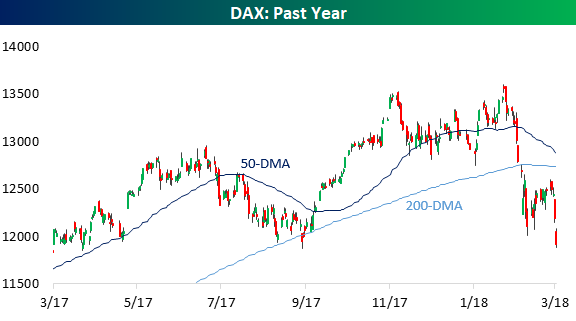
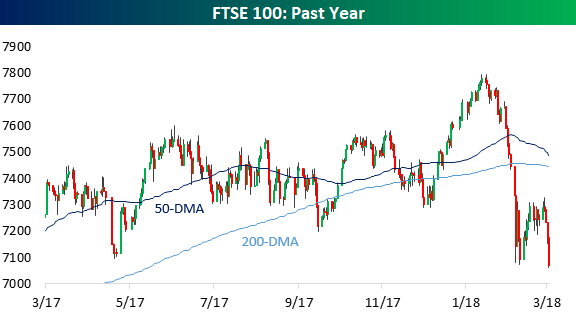
Global Equities At New Lows
US equities have had a bit of a bad week with 1% declines on Tuesday, Wednesday, and Thursday and the Dow now negative on the year. While that’s a rough run, local currency prices for equities in in the rest of the world are also in tough. Below we show charts for Europe (Stoxx 600), Italy (FTSE MIB), Spain (IBEX 35), Germany (DAX), UK (FTSE 100), and Japan (Nikkei 225). All 5 of those European indices are now below their 200-DMAs, with all but Italy at new closing 52-week lows. The Nikkei 225 is also right at its 200-DMA. In short, local equity markets around the world are not performing very well in local currency terms. For US investors, it’s less painful; the dollar’s drop versus EUR, GBP, and JPY over the past year means performance is much stronger.
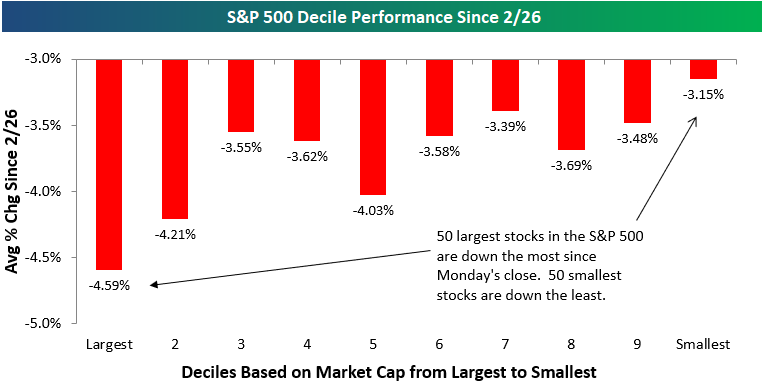
Mega Caps Underperforming on Trade War Sell-Off
Trump’s tariff announcement yesterday sent US equities reeling on trade war fears. A trade war would presumably impact the largest global companies much more than smaller cap, more domestically-oriented ones. In terms of stock price performance, it seems that investors agree with this presumption.
We ran our decile analysis on the S&P 500 based on market cap to see how the largest vs. smallest stocks in the index have performed during the sell-off that began on Tuesday. To run the analysis, we broke the index into deciles (10 groups of 50 stocks each) based on market cap, and then we calculated the average performance of the stocks in each decile since Monday’s close.
As shown below, the 50 largest stocks in the S&P 500 are down an average of 4.59% during this sell-off, which is easily the worst performing decile of the group. The average stock in the S&P 500 is down 3.73% since Monday’s close, so the 50 largest stocks are underperforming the average by 86 basis points. Conversely, the 50 smallest stocks in the S&P are down just 3.15% during the sell-off, which is the best performing decile of the group.
Given that the S&P 500 is a market cap weighted index, the largest stocks have a bigger impact on its price movement. When the largest stocks get hit the hardest as has been the case on this trade-war sell-off, it weighs heavily on the S&P. But on an equal-weighted basis, things don’t look quite as bad.
The Closer — Tariff Trouble, Auto Rubble, 2% Core PCE On The Double! — 3/1/18
Log-in here if you’re a member with access to the Closer.
Looking for deeper insight on markets? In tonight’s Closer sent to Bespoke Institutional clients, we break down what the announcement of new tariffs by the White House today means. We also discuss weak auto sales and strong inflation.

See today’s post-market Closer and everything else Bespoke publishes by starting a 14-day free trial to Bespoke Institutional today!
Bespoke’s Sector Snapshot — 3/1/18
We’ve just released our weekly Sector Snapshot report (see a sample here) for Bespoke Premium and Bespoke Institutional members. Please log-in here to view the report if you’re already a member. If you’re not yet a subscriber and would like to see the report, please start a two-week free trial to Bespoke Premium now.
Below is one of the many charts included in this week’s Sector Snapshot, which highlights the percentage of stocks in the S&P 500 that are trading above their 50-day moving averages. At just 25%, the current reading is very weak for market breadth.

To see our full Sector Snapshot with additional commentary plus six pages of charts that include analysis of valuations, breadth, technicals, and relative strength, start a two-week free trial to our Bespoke Premium package now. Here’s a breakdown of the products you’ll receive.