Bespoke’s Sector Snapshot — 3/29/18
We’ve just released our weekly Sector Snapshot report (see a sample here) for Bespoke Premium and Bespoke Institutional members. Please log-in here to view the report if you’re already a member. If you’re not yet a subscriber and would like to see the report, please start a two-week free trial to Bespoke Premium now.
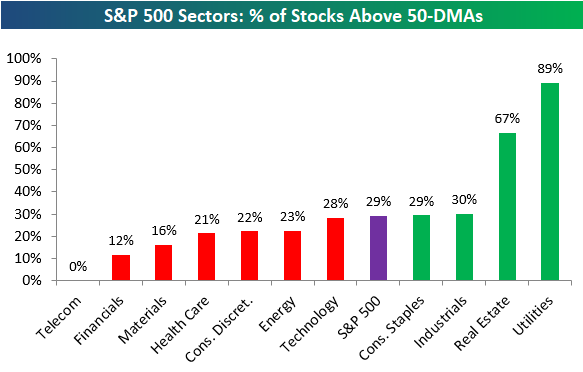
Below is one of the many charts included in this week’s Sector Snapshot, which highlights the percentage of stocks in S&P 500 sectors currently trading above their 50-day moving averages. As shown, just two sectors have breadth readings above the 50% mark, and they’re both defensive areas of the market (Utilities and REITS).
To find out what this means and to see our full Sector Snapshot with additional commentary plus six pages of charts that include analysis of valuations, breadth, technicals, and relative strength, start a two-week free trial to our Bespoke Premium package now. Here’s a breakdown of the products you’ll receive.
the Bespoke 50 — 3/29/18
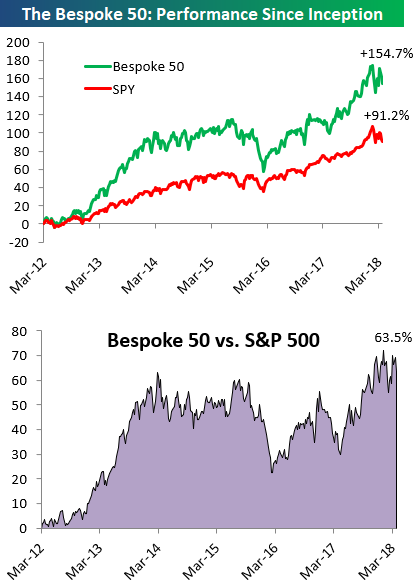
Every Thursday, Bespoke publishes its “Bespoke 50” list of top growth stocks in the Russell 3,000. Our “Bespoke 50” portfolio is made up of the 50 stocks that fit a proprietary growth screen that we created a number of years ago. Since inception in early 2012, the “Bespoke 50” has beaten the S&P 500 by 63.5 percentage points. Through today, the “Bespoke 50” is up 154.7% since inception versus the S&P 500’s gain of 91.2%. Always remember, though, that past performance is no guarantee of future returns.
To view our “Bespoke 50” list of top growth stocks, click the button below and start a trial to either Bespoke Premium or Bespoke Institutional.
Investors Retreat From Undecided As Bears Become More Common
As equity market volatility has picked up, the American Association of Individual Investors’ weekly poll of sentiment has deteriorated. Back in early January, bears were the second-lowest share of responses in the past decade. Since then, however, they’ve seen their share of the poll tick up by about 13 percentage points. While not at a very high level compared to recent years today, they are the highest since August of 2017. At the same time, investors who are indecisive about the market have seen their share of responses plunge. As shown in the second chart below, investors reporting “Neutral” sentiment are down from 45.2% of responses to 32.7% of responses.

New Lows For Initial Jobless Claims
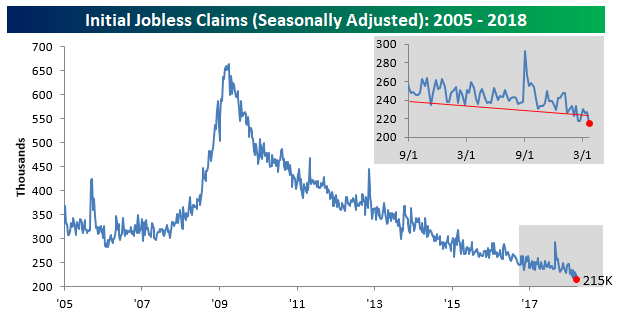
It was a big week for initial jobless claims. Versus economist expectations for 230,000, only 215,000 Americans filed initial claims for jobless benefits during the week of March 23rd. That’s a new cycle low and the lowest since the week of January 26, 1973. If claims drop 2,000 per week lower than their current levels, they’ll be back to a spot they haven’t hit in almost 50 years. Given the huge rise in the number of people employed and the overall population in that time period, we’d say that’s a pretty staggering statistic!
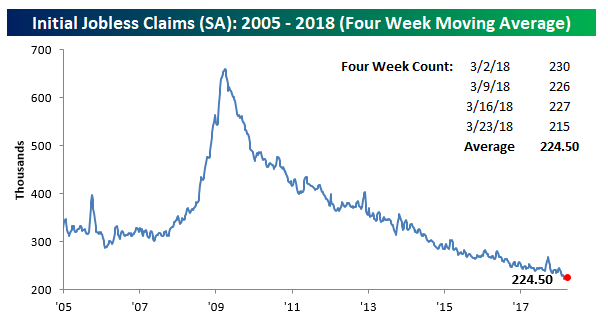
The 4-week moving average of claims is a little bit higher than the current reading, and is still a bit above the record lows for that reading set two weeks ago at 221,500. To return to that record low, claims would need to come in at 218k next week.
Finally, claims unadjusted for seasonality are down to 192,400. That compares with a recent average of over 310,000 for this week, and is the lowest NSA reading since the early 1970s.
April Seasonality for Commodities ETF
Our amazing new Stock Seasonality Tool lets users track seasonality trends for any stock, ETF, index, or asset class over any time period throughout the year. With the month of April starting up next week, we wanted to show how the various commodities ETFs have historically performed during the month.
The chart below is a direct snapshot from a search we ran in our Stock Seasonality Tool. It shows the five best and worst performing commodities ETF during the month of April on a media basis over the last 12 years. Natural gas has been in a downtrend for years now, but interestingly, UNG has been the best performing commodity ETF in April with a median gain of 3.57%. Behind UNG is DBC, DJP, MOO, and DBE. DBC and DJP are two broad commodity ETFs, while MOO tracks agribusiness.
On the downside, there are three commodity ETFs that have posted median declines in April over the last 12 years — Silver (SLV), Coffee (JO), and precious metals (DBP). Silver (SLV) has been the worst performing commodity ETF in April over the last 12 years with a median decline of 3.05%.
Start a free trial to Bespoke Premium to begin using our Stock Seasonality Tool now. You can track seasonal trends for all individual stocks and ETFs using the tool, and you can monitor up to five custom portfolios as well.
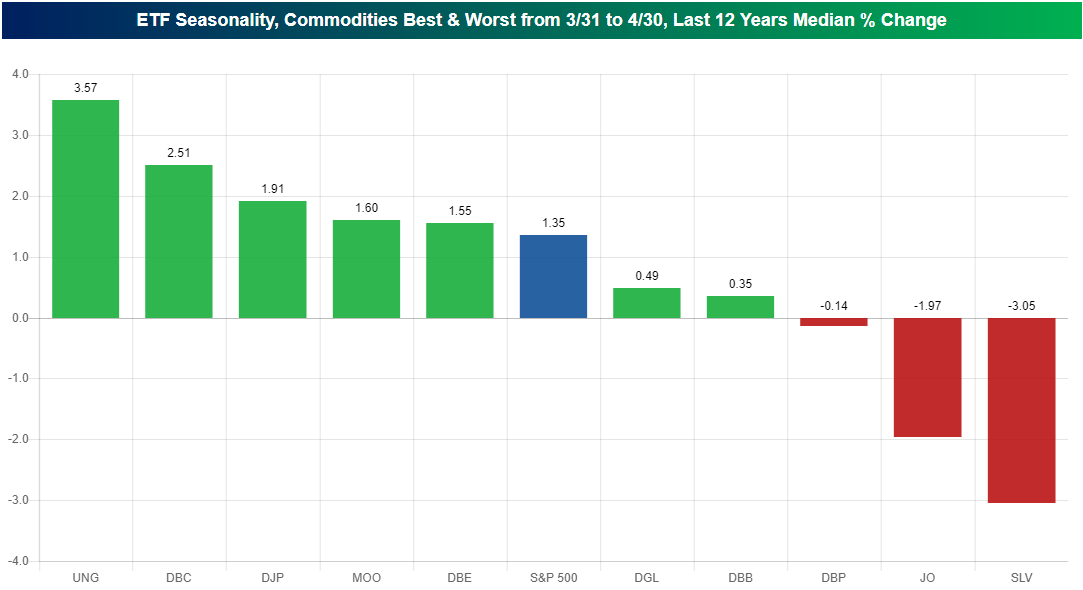

Chart of the Day: Marine Infrastructure Ahoy
B.I.G. Tips – April 2018 Seasonality
The Closer — GDP, Energy — 3/28/18
Log-in here if you’re a member with access to the Closer.
Looking for deeper insight on markets? In tonight’s Closer sent to Bespoke Institutional clients, we review the Q4 2017 GDP print and advance trade data as well as EIA weekly petroleum market data and energy asset price action.

See today’s post-market Closer and everything else Bespoke publishes by starting a 14-day free trial to Bespoke Institutional today!
Chart of the Day: Global Equities Hanging Around the 200-DMA Too
Fixed Income Weekly – 3/28/18
Searching for ways to better understand the fixed income space or looking for actionable ideals in this asset class? Bespoke’s Fixed Income Weekly provides an update on rates and credit every Wednesday. We start off with a fresh piece of analysis driven by what’s in the headlines or driving the market in a given week. We then provide charts of how US Treasury futures and rates are trading, before moving on to a summary of recent fixed income ETF performance, short-term interest rates including money market funds, and a trade idea. We summarize changes and recent developments for a variety of yield curves (UST, bund, Eurodollar, US breakeven inflation and Bespoke’s Global Yield Curve) before finishing with a review of recent UST yield curve changes, spread changes for major credit products and international bonds, and 1 year return profiles for a cross section of the fixed income world.
In this week’s note, we make the case that the bounce in bond prices is likely to continue.

Our Fixed Income Weekly helps investors stay on top of fixed income markets and gain new perspective on the developments in interest rates. You can sign up for a Bespoke research trial below to see this week’s report and everything else Bespoke publishes free for the next two weeks!
Click here and start a 14-day free trial to Bespoke Institutional to see our newest Fixed Income Weekly now!