
Mind the Gap
The quarter is coming to a close, and if there is one part of the market that is turning the calendar as a winner, it’s the semiconductors. As we noted in yesterday’s Chart of the Day, of all S&P 500 industry groups, the semis blew away the rest of the pack this quarter.
There are multiple ways to look at the semis. While squaring away S&P 500 members that are part of the industry is one option, another more widely quoted version is the PHLX Semiconductor Index (SOX). Additionally, there are the mid-cap (S&P 400) and small cap (S&P 600) semiconductor industry indices.
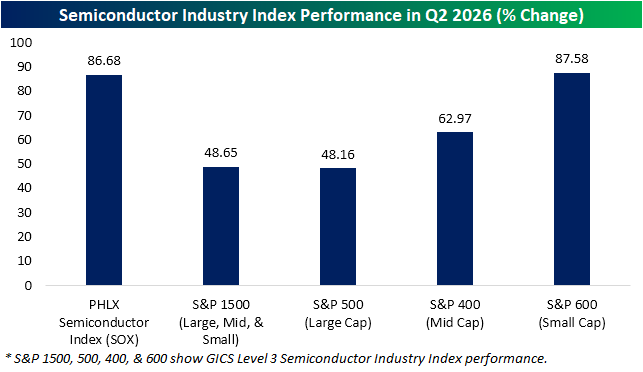
As shown below, whereas the S&P 500’s semiconductor index was up an impressive 48% on the quarter, the SOX blew the doors off, up almost 87%. Likewise, the mid- and small-cap semis outperformed the large cap semis with gains of 63% and 88%, respectively. Of course, index construction and methodology between those proxies on the space differ, but when it comes to the S&P 500 industry group versus the SOX, it was a record gap for any quarter since the second half of 1994.
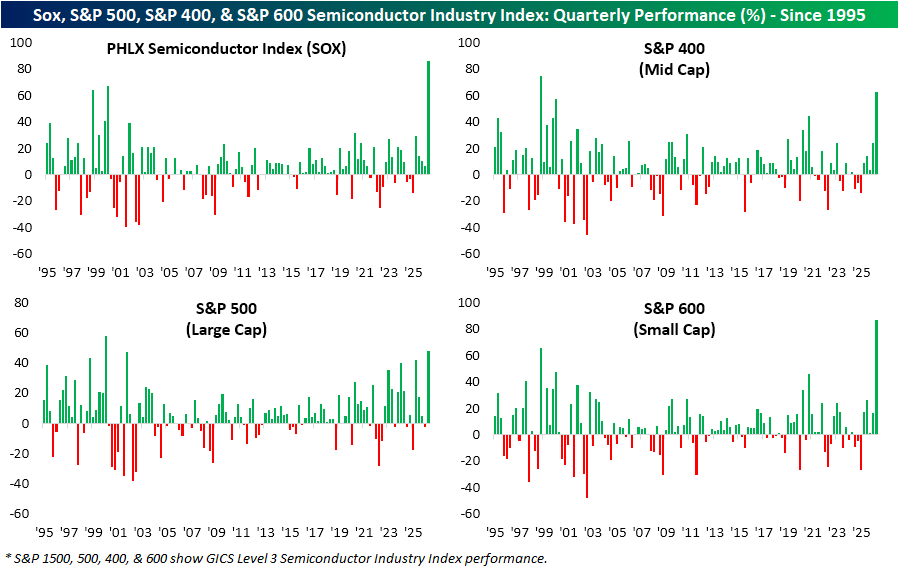
Below we show the quarterly performance of the SOX since 1995 in addition to the performance of the S&P 500, 400, and 600 semi industry indices. Again, it was a record showing for the SOX in Q2. Like the SOX, it was also a record quarter for the semis within the small cap S&P 600 semiconductor index. The mid-cap S&P 400 semiconductors had its second best quarter to date (behind a 75.3% rally in Q4 1997), and the large cap S&P 500 semiconductor industry (which is now the largest industry group by weight), had its best quarter since Q1 2000.
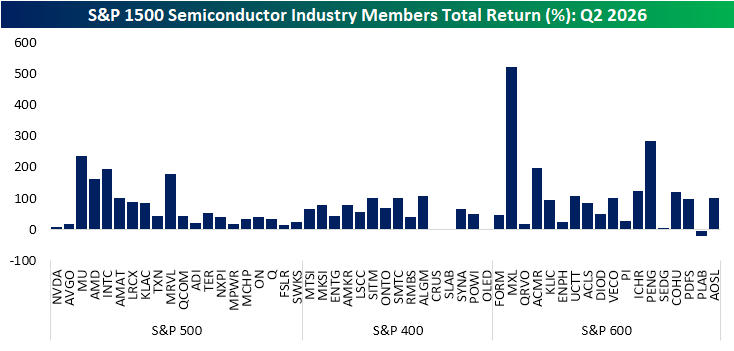
Below, we show the individual quarterly returns of S&P 1500 semiconductor members, sorted from largest to smallest by market cap.
At the top, two of the largest names, Nvidia (NVDA) and Broadcom (AVGO), actually posted some of the smallest returns of the industry in Q2. Granted, the next largest stock and newest member of the trillion dollar market cap club, Micron (MU), was one of the best performing semis. Looking down the list, there were also a couple of huge gainers among the small caps like an astounding 523% gain from Maxlinear (XML) and a 286% rally from Penguin Solutions (PENG). Further, only two were in the red: Universal Display (OLED) and Photronics (PLAB).
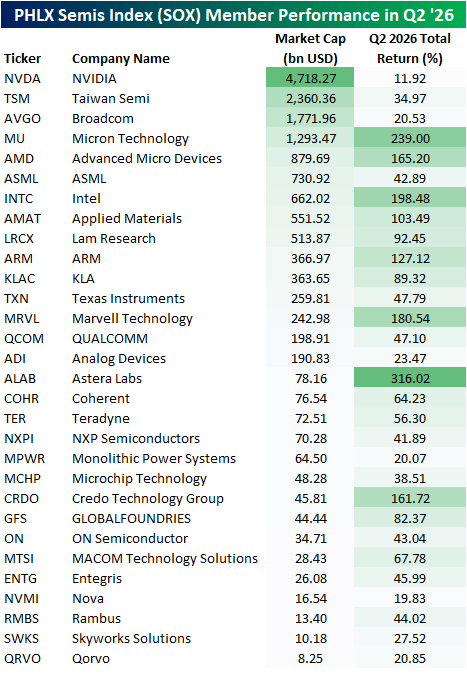
Again, while semiconductor returns in Q2 were good everywhere, at the index level it was a massive gap between the performance of small caps and the SOX versus the S&P 500 or the mid-cap S&P 400. The reason for the gap is multi-faceted. For starters, composition of the indices differs. For example, the SOX, unlike the S&P indices, can include non-US headquartered companies such as Taiwan Semi (TSM) and has no earnings requirements.
Further methodological differences mean the same stock can have different impacts between two indices. As a part of the S&P 500, the S&P 500 Semiconductors index is weighted by pure float-adjusted market capitalization, whereas the SOX applies a tiered cap structure; capping its largest constituent at 12%, the second-largest at 10%, the third-largest at 8%, and all others at 4% with excess weight redistributed to smaller constituents. In other words, the largest stock in both indices (which today is NVDA) has a greater impact on the S&P 500 than it does in the SOX where its impact is dampened due to the cap. NVDA was the single worst performer of SOX members in Q2 with an 11.9% gain. The runner-ups in size, Broadcom (AVGO) and Taiwan Semi (TSM), likewise were underperformers.
The weight cap meant this underperformance was less of a drag on the SOX whereas the uncapped methodology of the S&P 500 resulted in the weaker performance of Nvidia to be more of a factor. Conversely, the smaller market cap stocks with big runs like Astera Labs (ALAB) or Marvell Tech (MRVL) would have smaller impacts on an S&P index and amplified impacts on the SOX.
Want more from Bespoke? You can start by joining our Think BIG mailing list, where you’ll receive an interesting market stat in your inbox a few times per week. All we need is your email address. Join now by clicking here or on the image below.

Nike (NKE) – Can the Swoosh Recover?
Nike (NKE) is set to report earnings after the close after falling more than 20% in Q2. Below is a look at NKE’s price chart since early 2022. It’s ugly.
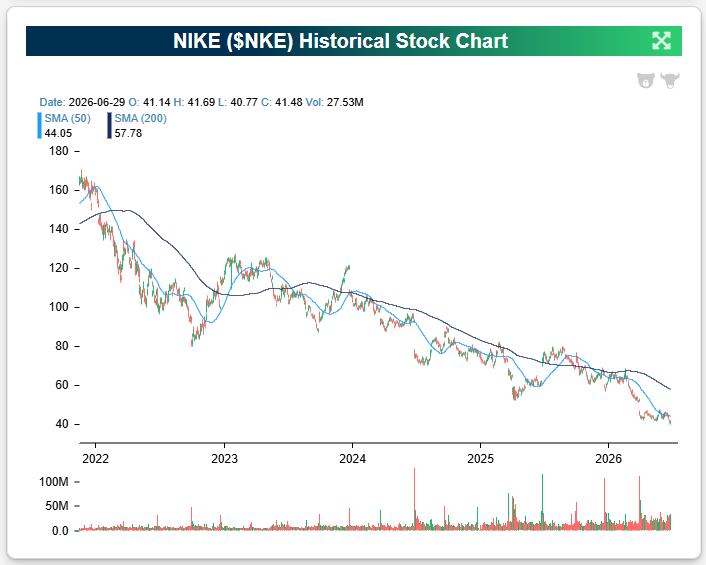
It hasn’t just been a bad year for Nike (NKE), but rather a bad decade.
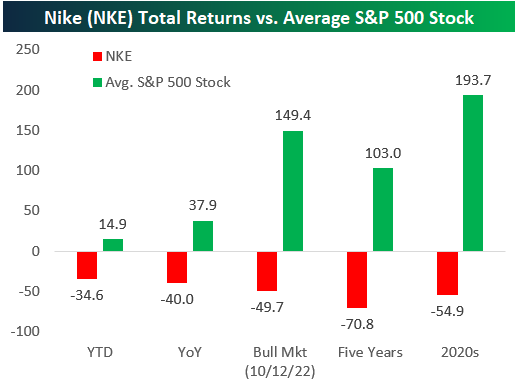
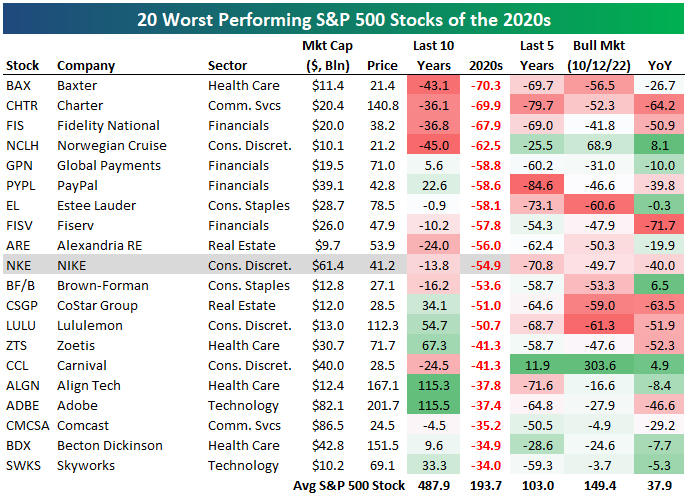
So far in the 2020s, the average stock in the S&P 500 is up 193.7%. NKE is down 54.9%.
As shown below, during the current bull market that began in October 2022, the average stock is up 149.4% versus NKE’s decline of 49.7%.
Over the last five years, NKE is down more than 70%, while the average S&P stock has more than doubled.
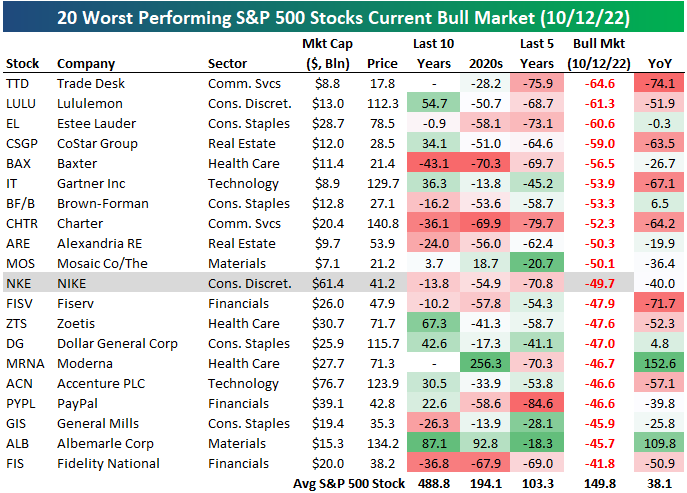
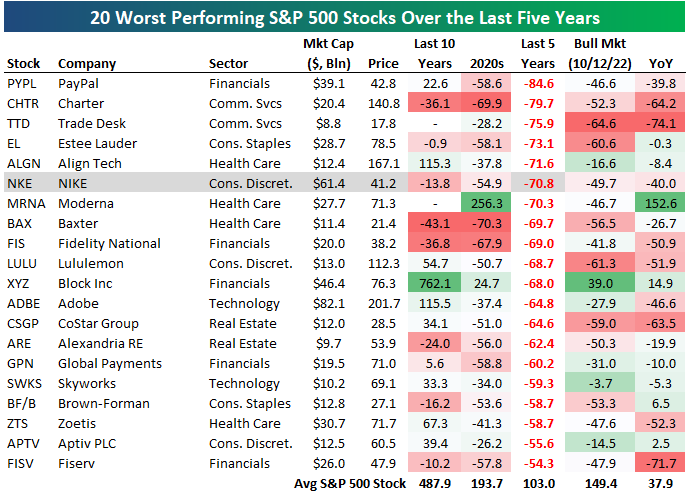
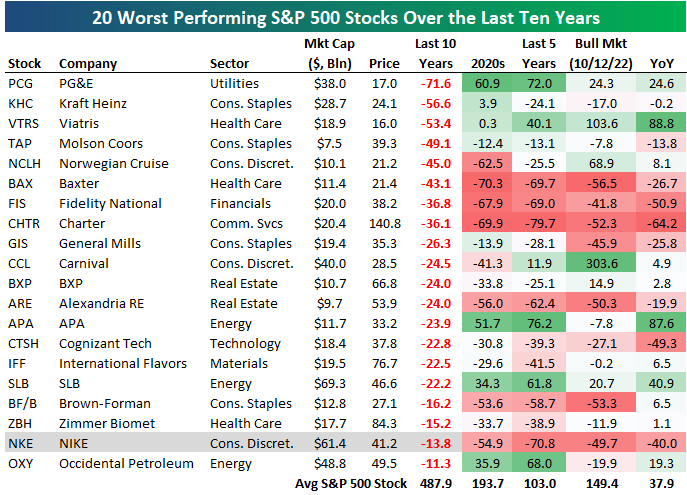
Below we show tables of the 20 worst performing current S&P 500 members over various time frames: during the current bull market, over the last five years, since the start of 2020, and over the last ten years.
Nike ranks in the bottom 20 across all four time frames.
During the current bull, NKE has been the 11th worst performing S&P 500 stock. Over the last five years, NKE has been the sixth worst. NKE ranks as the tenth worst since the start of 2020, and it has been the 19th worst over the last ten years.
This has been an almost unimaginable decline for what was one of the bluest of blue chips out there. NKE has to be one of the most disappointing stocks of the 2020s at this point. It has three and a half years left to turn the decade around, though, and America certainly loves a comeback story!
Want more from Bespoke? You can start by joining our Think BIG mailing list, where you’ll receive an interesting market stat in your inbox a few times per week. All we need is your email address. Join now by clicking here or on the image below.
Q1 2026 Earnings Conference Call Recaps: AeroVironment (AVAV)
Bespoke’s Conference Call Recaps use AI to summarize lengthy earnings calls. The commentary below is AI-generated and then edited by Bespoke for quality control. As always, none of these summaries should be construed as recommendations to buy or sell any securities, and investors should do their own research and/or consult with a financial professional before making any investment decisions.
Our latest recap available to Bespoke subscribers covers AeroVironment’s (AVAV) Q4 2026 earnings call.

AeroVironment (AVAV) is a defense-technology company that makes unmanned aircraft systems (UAS), loitering munitions, one-way attack drones, counter-drone systems, directed-energy weapons, missile interceptors, space communications equipment, and mission software. Its products serve the US military and allied governments, giving investors a view into drone warfare, missile-stockpile rebuilding, defense-budget priorities, satellite modernization, and the push toward cheaper, scalable weapons. AVAV reported record quarterly revenue of $642 million, up 31% organically, with $572 million of bookings and $1.2 billion of funded backlog. Demand was strongest for Switchblade (loitering munitions), Red Dragon (one-way attack drones), Titan (radio-frequency counter-drone systems), and JUMP 20 (UAS). Management described counter-UAS as an early-stage growth market: Titan sales doubled, LOCUST (a directed-energy laser weapon) can defeat drones for under $10 per shot, and Freedom Eagle-1 (a low-cost missile interceptor) is being designed to intercept drones for roughly $100,000–$150,000 versus millions for traditional missiles. AVAV is investing 12%–14% of revenue in capacity across Salt Lake City, Huntsville, Albuquerque, and Dayton, leaving fiscal 2027 free cash flow negative. Guidance assumes defense-budget delays push orders and profits toward the second half, but management expects strong US and international demand as inventories remain depleted. AVAV shares were up more than 15% on 6/30 in reaction to better-than-expected EPS and revenue…
Continue reading our Conference Call Recap for AVAV by becoming a Bespoke Institutional subscriber. You can sign up for Bespoke Institutional now and receive a 14-day trial to read our newest Conference Call Recap. To sign up, choose either the monthly or annual checkout link below:
Chart of the Day – 6/30/26 – Stay in July
Bespoke’s Morning Lineup – 6/30/26 – Put a Bow On It
See what’s driving market performance around the world in today’s Morning Lineup. Bespoke’s Morning Lineup is the best way to start your trading day. Read it now by starting a two-week trial to Bespoke Premium. CLICK HERE to learn more and start your trial.
“Commerce with all nations, alliance with none, should be our motto.” – Thomas Jefferson

Below is a snippet of commentary from today’s Morning Lineup. Start a two-week trial to Bespoke Premium to view the full report.
US stocks are looking to close out what has been a very strong quarter on a positive note. S&P 500 futures are slightly higher with a gain of 0.10%, while the Nasdaq is up 0.25%. Treasury yields are slightly higher, with the 10-year yield trading just below 4.4%. Crude oil prices, along with gold, are slightly higher, while Bitcoin is down over 2% and trading back below $59K.
In Asia, stocks had a mixed session with the Nikkei rallying 0.9% and South Korea gaining 1.0%. In the other direction, Hong Kong fell 0.6%. Chinese PMI data for June came in slightly better than expected for both the Manufacturing and Services sectors, with both coming in above 50, the threshold for expansion. In South Korea, Retail Sales rebounded 0.1% in May after falling 3.5% in April, but Industrial Production fell 3.0%, accelerating April’s 0.7% pace of decline.
European stocks are closing out the quarter on a much stronger note. The STOXX 600 is up over 1%. Germany is leading the gains (even though they were knocked out of the World Cup) with a gain of 1.5%, while France and Spain are both up 0.6% or less. Along with the strength in German stocks, Retail Sales in the country surprised to the upside, rising 1.1% versus forecasts for no change. In France and Italy, there was also some good news on the inflation front as CPI for June came in weaker than expected.
Getting back to the US, the only data on the calendar is the Chicago PMI at 9:45 and Consumer Confidence and JOLTS at 10 AM. In terms of earnings, we’ll also get reports from Nike (NKE) and Constellation Brands (STZ) after the close. NKE is coming off back-to-back quarterly reports of falling by double-digits, while STZ has reacted positively to each of its last five reports.
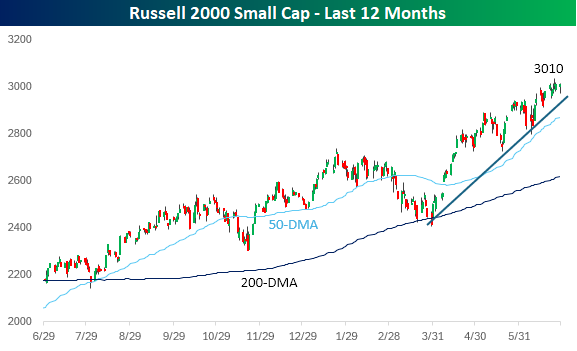
With a gain of 21.3% YTD, the Russell 2000 is on pace for its best first half of the year since 1991.
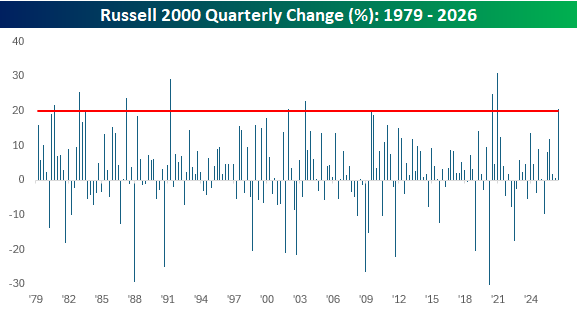
Because almost all the gains were squeezed into Q2, the small-cap benchmark is on pace for a quarterly gain of over 20%, which would mark the best quarter since the Q4 2020 post-Covid reopening rally (+31%), which was also the largest quarterly gain in the index’s history.
As the chart below illustrates, the period coming out of Covid not only included the Russell’s strongest-ever quarter but also two quarters within a three-quarter period when it rallied more than 20%.
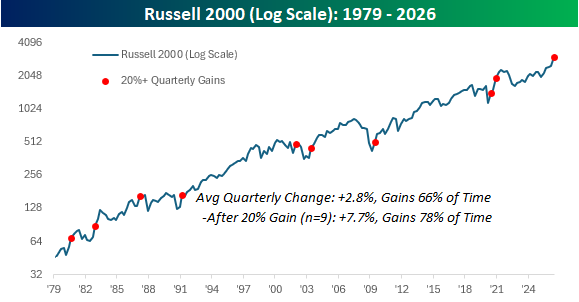
The chart below shows where each prior quarterly 20%+ gain occurred within the long-term history of the Russell 2000. They have occurred within all stages of bull market cycles, so it’s hard to say much in terms of what they indicate, but it is worth pointing out that following the nine prior quarterly gains of at least 20%, the Russell 2000’s average change in the following quarter was a gain of 7.7% with positive returns 78% of the time. That’s more than twice the 2.8% average gain for all periods since 1979.
From a short-term perspective, small-caps look a bit stretched and have shown a slight loss of momentum over the past week. The index is also still trading 5% above its 50-day moving average, which means that a minor pullback wouldn’t even do significant technical damage.
The key test will be the recent index rebalancing. Many of the top-performing stocks that drove the Russell 2000 to these heights “graduated” to the Russell 1000 in last week’s rebalancing. For the rally to continue, the index will need some new blood to step up.
Start a two-week trial to Bespoke Premium to continue reading today’s full Morning Lineup.
The Closer – Independence Affirmed, Magnificent Day for Mag 7 – 6/29/26
Log-in here if you’re a member with access to the Closer.
- With today’s decision on Fed Governor Lisa Cook, the Supreme Court affirmed the independence of the Fed.
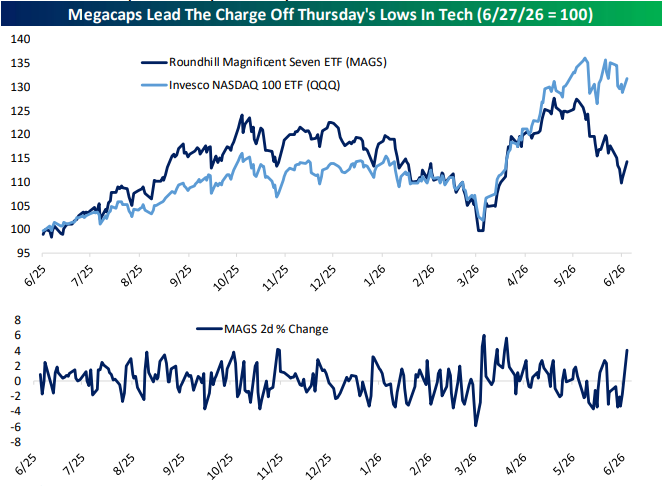
- The Magnificent 7 had their best two-day showing since April today as the group has diverged from the rest of the large caps over the past couple of months.
- Our Five Fed average of regional Fed manufacturing activity indices finished June at a fractional new high for the current cycle.
See today’s full post-market Closer and everything else Bespoke publishes by starting a 14-day trial to Bespoke Institutional today!
Daily Sector Snapshot — 6/29/26
You Say Up, I Say Down
With five straight down days last week, you wouldn’t expect to see breadth, which has been weak for several weeks, to suddenly show strength, but that’s exactly what we saw last week. Through Friday’s close, the S&P 500 has more daily gainers than losers (positive breadth) for six straight days, which was tied for the longest streak of positive readings in nearly a year.
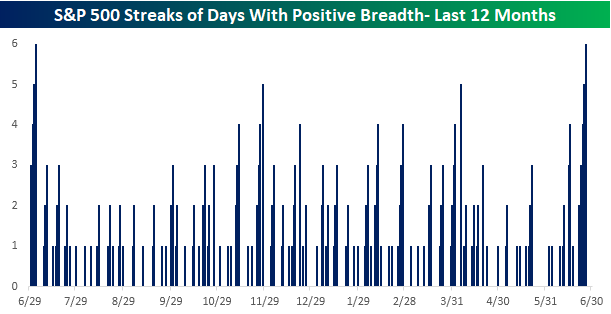
Just as unusual as last week’s positive breadth amid a falling market, today, the S&P 500 is up over 1%, and breadth is negative. After five straight days of positive breadth divergences last week, today we’re seeing a negative breadth divergence, extending the streak of divergent breadth days to a record six trading days. Like an unhealthy relationship, price and breadth just can’t seem to agree on anything.
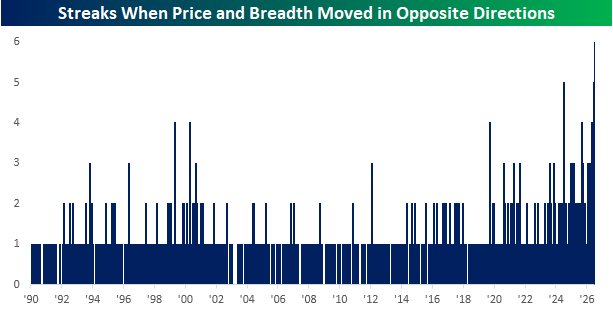
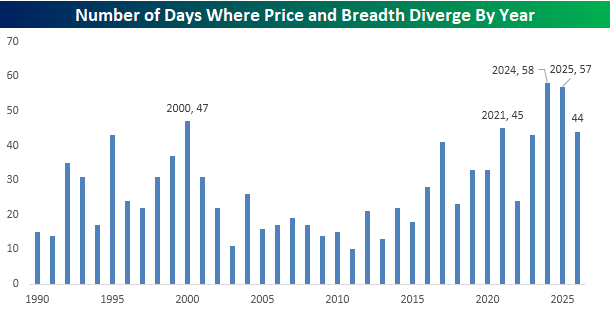
Besides the fact that we’re currently in the middle of the longest streak of divergent breadth days on record, the chart below also shows an increasing frequency of divergent breadth days in recent years. The chart below breaks down the number of diverging days by year. The record for most diverging days was 58 in 2024, followed by 57 in 2025 (we told you there was an increased frequency in recent years), but this year there have already been 44 – and the year is only half over!
There’s obviously no guarantee that the pace of diverging days in the second half will match the pace in the first half; if it did, the S&P 500 would have 88 diverging breadth days in 2026. That’s 30 more than the prior record from 2024 and works out to more than once every three trading days!
Want more from Bespoke? You can start by joining our Think BIG mailing list, where you’ll receive an interesting market stat in your inbox a few times per week. All we need is your email address. Join now by clicking here or on the image below.
Going Nowhere
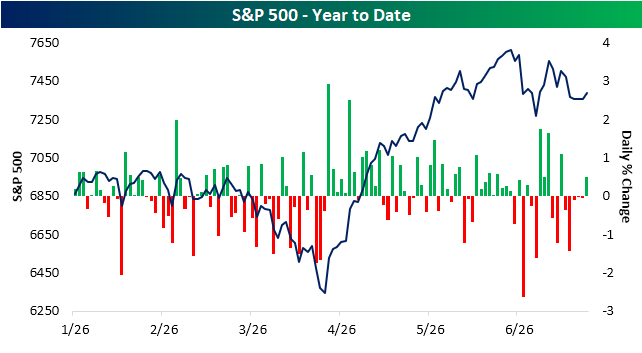
The S&P 500 is kicking off the week with a gain of over 1% as of midday Monday. In multiple ways, it has been a sharp turnaround from last week. For starters, last week saw the S&P 500 fall on all five trading days, with the last three sessions having remarkably small moves. As shown below, the index was basically flat from Wednesday to Friday as each day didn’t even see a move greater than 10 bps. Additionally, we would note that despite the five-day losing streak, it wasn’t exactly all doom and gloom as the index also had positive breadth on each of the five days.
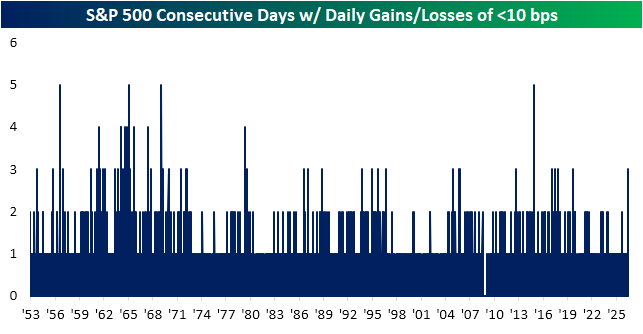
Historically, it has been uncommon for the S&P 500 to move so little day-to-day as it did last week. As shown below and as we first highlighted in Friday’s Sector Snapshot, last week was the first time the index rose or fell less than 10 bps for at least three days in a row since September 2019. In total, since the start of the five-day trading week in 1953, the S&P 500 has only had similar streaks 53 times (including this most recent instance). Given the over 1% gain as of this writing, the current streak is likely to end today, which would check out historically as only a handful of these prior streaks extended to more than three days. In fact, since 1970 only two streaks have lasted more than three days: a four-day streak ending in May 1979 and a five-day streak ending in November 2014.
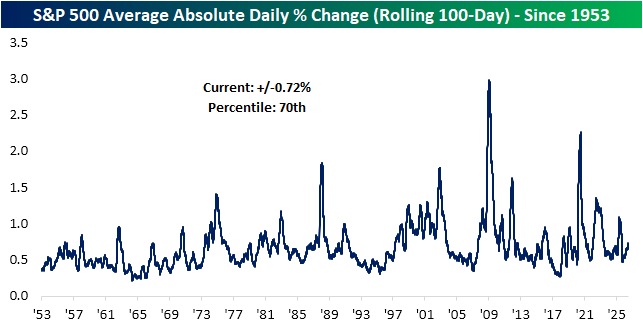
Finally, we would note that this latest string of snoozer sessions comes on a slight upswing in volatility. As shown below, over the past 100 sessions, the S&P 500 has averaged a move of 0.72%. While that’s far from earning any superlatives, it ranks in the 70th percentile of readings over the past several decades.
Want more from Bespoke? You can start by joining our Think BIG mailing list, where you’ll receive an interesting market stat in your inbox a few times per week. All we need is your email address. Join now by clicking here or on the image below.