Chart of the Day: BJ’s Restaurants (BJRI)
B.I.G. Tips – Retail Sales Mixed
Empire Manufacturing Report Better Than Expected
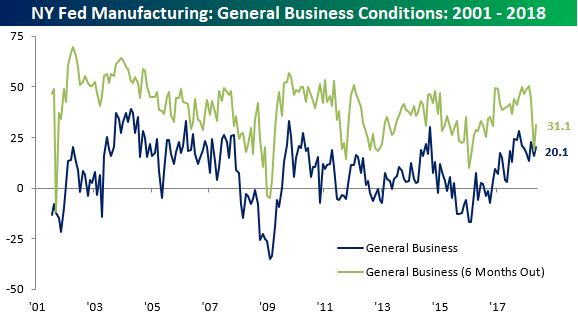
Tuesday’s release of the Empire Manufacturing report for the month of May came in better than expected with the headline index rising back up to 20.1 from last month’s level of 15.8. Economists, meanwhile, were looking for a modest decline. You may recall that in last month’s report, we saw expectations for conditions six-months from now come crashing down, but this month they saw a bit of a rebound. Even after the bounce, though, the expectations components of the headline index and each sub-sector are still well off their levels from two months ago.
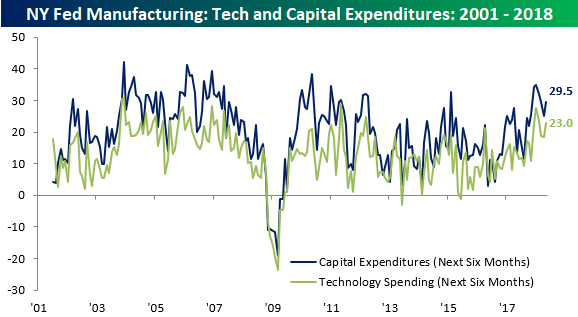
Plans for Technology Spending and Cap Ex also both saw sharp declines last month, and like the expectations index above, they rebounded in May, but are still well off their prior highs.
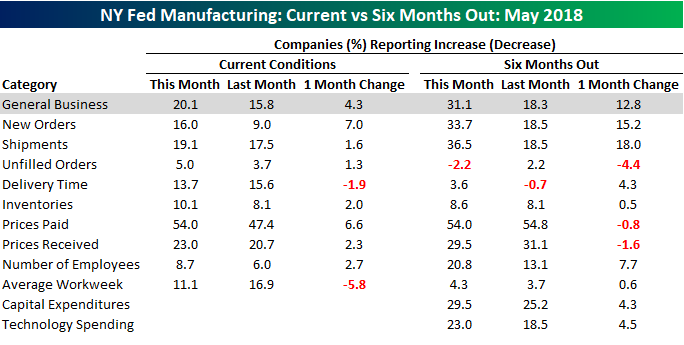
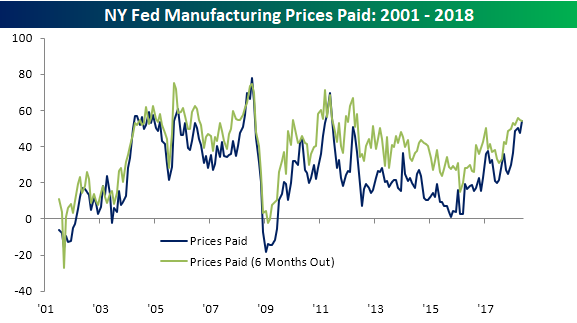
The table below breaks out each of the Empire Manufacturing report’s components on both a current and six-months out expected basis. For both current conditions and expectations, May’s readings were mostly better than April. One interesting trend worth noting is Prices Paid. The readings for that component’s current conditions and expectations for six months from now are currently at 54.0. As the chart below illustrates, though, it is very uncommon for both of these components to have similar levels.
Homebuilder Sentiment Bounces Back
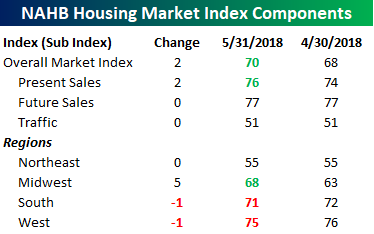
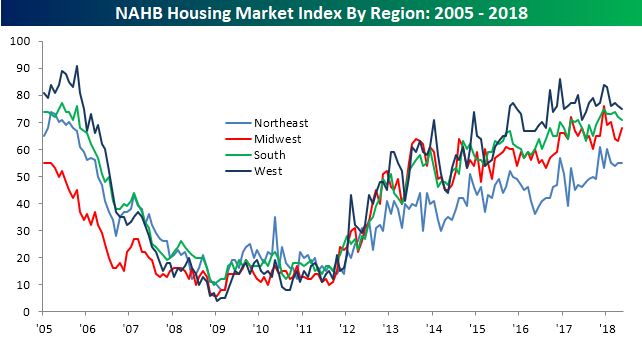
After four straight months of m/m declines, homebuilder sentiment finally saw a bounce this month, rising from a six-month low of 68 last month to 70 in May. While homebuilder sentiment is still pretty well off its highs from December, the trend of higher highs and higher lows remains intact.

The table below breaks down this month’s report by present and future sales, traffic, and region. All of this month’s improvement in the headline reading came from a jump in Present Sales, while Future Sales and Traffic were both unchanged. On a regional basis, sentiment in the Midwest saw a big jump, was unchanged in the Northeast and saw slight declines in both the South and West.
Bespoke Stock Scores — 5/15/18
The Closer — You Down With GDD? — 5/14/18
Log-in here if you’re a member with access to the Closer.
Looking for deeper insight on markets? In tonight’s Closer sent to Bespoke Institutional clients, we review a new international debt dataset released by the IMF.

See today’s post-market Closer and everything else Bespoke publishes by starting a 14-day free trial to Bespoke Institutional today!
Eight Makes it Great
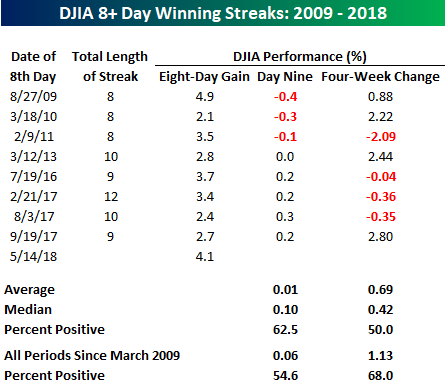
While the DJIA wasn’t quite able to hang on to its highs from earlier in the day, it still managed to finish the day higher on Monday, extending its streak of daily gains to eight. That’s right, the Dow hasn’t had a one-day decline since May 2nd! The table and chart below highlight each of the DJIA’s winning streaks of eight or more trading days since the prior bear market lows in March 2009. As the chart illustrates, during the first two years of the bull market there were three such streaks. Then, in the five-year stretch from March 2011 through March 2016, there was only one streak of eight or more days. In the last two years, though, the pace of streaks has picked up again with five.
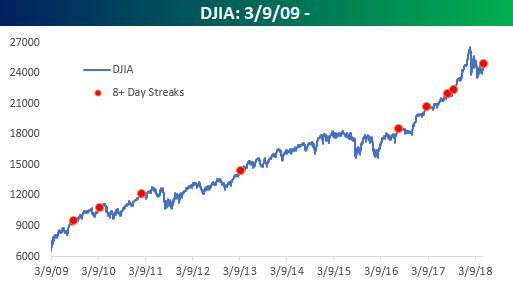
In the table below, we have listed the date of the 8th straight up day during each of the prior streaks along with the total number of days the streak lasted, the Dow’s performance during the first eight days, as well as its performance on day nine and over the next four weeks. Interestingly, based on the eight prior periods, the DJIA has a better than average chance of extending the streak to nine days and has been higher on the day after each of the last five eight-day streaks. Over the next four weeks, the average (0.69%) and median (0.42%) returns are also positive, but in this case, it really is a coin flip as to whether the Dow rises or falls with four-periods of gains and four of losses.
B.I.G. Tips – Analyst Sentiment by Market Cap, Sector
Chart of the Day: Analysts Like What They Hear
Consumer Staples An Epic Underperformer
Within the broader equity market these days, there probably isn’t a sector that is more out of favor than Consumer Staples. As consumers have shifted their tastes away from brands that dominated the economy of their parent’s generation, the stocks in the sector have been big market laggards. The chart below shows the relative strength of the Consumer Staples sector versus the S&P 500 since 1980. A rising line indicates outperformance on the part of the Consumer Staples sector, while a falling line indicates underperformance. After dominating the market in the 1980s, Consumer Staples performed inline with the market throughout most of the 1990s until the Tech bubble where they fell out of bed on a relative basis. By March 2000, there wasn’t a lonelier place to be in the market than Consumer Staples.
When the dot-com bubble burst, though, Consumer Staples saw a major rebound relative to the market and quickly regained all of the ground it lost during the late 1990s. Suddenly, stocks like Procter & Gamble (PG), Coca-Cola (KO), and Pepsi (PEP) that no one cared about a couple of years earlier were the new market darlings. Then in the bull market that followed, the sector fell out of favor again until the Financial crisis as investors shifted their focus to more growth-oriented names. Throughout the current expansion, Consumer Staples once again slowly lost ground relative to the market as investors started to drift away from defensive sectors.
In the last two years, the pace of underperformance has really started to accelerate, causing the sector’s relative strength to fall to an 11-year low versus the S&P 500. Once again, P&G and stocks like it are as popular as snow in April. How unpopular is the sector? Even after the sharp drop in relative strength, one major Wall St. firm just downgraded Consumer Staples to underweight!

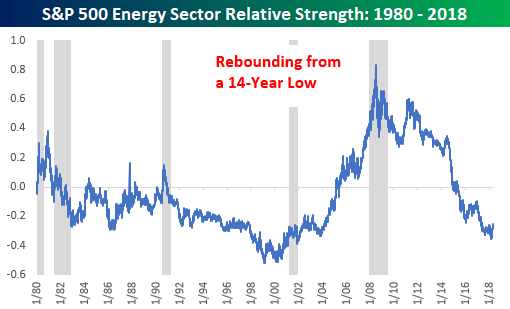
In terms of relative strength, one sector that is just starting to emerge from years of underperformance is Energy. The sector has seen a big rally over the last few months and is currently less than 3% from a 52-week high. Looking at the sector’s relative performance versus the S&P 500, though, you wouldn’t know it as you can barely see the turn higher.