B.I.G. Tips – Retail Sales Finally Post a Beat
Bespoke Brunch Reads: 4/15/18
Welcome to Bespoke Brunch Reads — a linkfest of the favorite things we read over the past week. The links are mostly market related, but there are some other interesting subjects covered as well. We hope you enjoy the food for thought as a supplement to the research we provide you during the week.
Long Reads
Tariffs increase savings in a world already drowsy with too much savings by Michael Pettis (FTAV)
An argument that because modern trade deficits balance capital flows instead of vice-versa, efforts to reduce trade imbalances via tariffs will only make underlying problems worse. [Link; registration required]
A Graphic History of the War (US War Department May 1942)
An amazing graphic representation of the economic, strategic, and military background for the Second World War in the months after Pearl Harbor. [Link; 76 page PDF, very large file]
World After Capital by Albert Wenger (Git Books)
This online book argues that we are in the midst of a transition as profound as the industrial revolution, in which attention will become more important than capital. [Link]
This Week In Trump
Stock market cooling off from the ‘Trump bump’ by Sylvan Lane (The Hill)
After the stock market surged last year thanks in part to policy changes and business optimism, the “Trump bump” in stocks has given way to volatility and a significant drawdown. [Link; auto-playing video]
Feds Raid Office of Trump Lawyer Who Paid Off Stormy Daniels. This Is a Big Deal. by Ken White (Reason)
A legal analysis of the implications of the FBI’s search warrant against Trump fixer/lawyer Michael Cohen this week. [Link]
Tech
Apple, Amazon and Google Also Are Bracing for Privacy Regulations by Christopher Mims (WSJ)
While Facebook CEO Mark Zuckerberg’s trip to the Hill went pretty well this week, public opinion and political pressure is swinging against the hands-off approach taken so far with respect to privacy. [Link; paywall]
Now you can get Spotify and Hulu together for just $12.99 each month by Chris Welch (The Verge)
Just when you thought that the bundle was dead, new ones are emerging. In this case, consumers are getting the option to pay for music and Hulu together. [Link]
Silicon Valley Powered American Tech Dominance—Now It Has a Challenger by Phred Dvorak and Yasufumi Saito (WSJ)
While the United States is still the undisputed king of the venture capital funding world, early-stage investments in China have surged as the space has expanded globally. [Link; paywall]
Dark Side of Social
Your Pretty Face is Going to Sell by Joe Vix (SF MoMA)
YouTube has a human face, and that face is a physical, indeed personal, manifestation of click bait in human form. [Link]
When Jack Dorsey’s Fight Against Twitter Trolls Got Personal by Austin Carr (Fast Company)
The CEO of Twitter is taking an increasingly decisive role in the company’s approach to dealing with trust and safety, a neat space that encompasses many facets of how users experience the social network. [Link]
Economic Research
How the Reformulation of OxyContin Ignited the Heroin Epidemic by William N. Evans, Ethan Lieber, and Patrick Power (NBER Working Papers)
An intensive analysis of the drivers of the opioid epidemic, which the authors attribute over-perscription of legal pain medications then to changes in the formulation of OxyContin. Make sure to browse through the charts starting on page 28. [Link; 50 page PDF]
The 10-Year Baby Window That Is the Key to the Women’s Pay Gap by Claire Cain Miller (NYT)
Women who have babies after the age of 35 don’t see a pay gap develop similar to that of women who have children earlier according to a new study; established careers end up making a big difference. [Link; soft paywall]
The Geography of Social Capital in America (Joint Economic Committee)
At the request of Senator Mike Lee (R-UT), Congressional staff prepared a huge look at the role of social capital and where it is strongest (or weakest). [Link; 78 page PDF]
America’s Gradebook: How Does Your State Stack Up? (Urban Institute)
The National Assessment of Educational Progress is a helpful like-for-like comparison of educational outcomes across the United States. But crucially it does not account for varying demographics; when accounting for those, a very different picture of achievement is seen in the data. [Link]
Energy
What Happened to the Oil Glut? by Benoit Faucon, Summer Said, and Anant Vijay Kala (WSJ)
As US rig counts dropped, demand took off thanks to price, and OPEC cut output, the massive ocean of stored crude which emerged in 2014-2017 started to drain out into the market. [Link; paywall]
Finance
Credit Card Signatures Are About to Become Extinct in the U.S. by Stacy Cowley (NYT)
With the advance of chip technology, signatures are now obsolete and that will be formalized when the major networks stop requiring them next month. [Link; soft paywall]
The Great Blackstone Swaps Saga Just Became a Whole Lot Crazier by Sridhar Natarajan (Bloomberg)
A complicated series of transactions by homebuilder Hovnanian and Blackstone’s credit unit have created a serious problem for the credit default swap market. [Link; auto-playing video]
Sports, Sort Of
ESPN Brought To Its Knees By Reply Allpocalypse by Tom Ley (Deadspin)
Anyone working in a large organization knows the trials and tribulations of accidentally cc’ing the wrong list of addresses and in one instance this week that drama got taken to another level at the Worldwide Leader. [Link]
World Cup 2018 BLOODBATH: Russian hooligans warn England fans ‘Prepare to DIE’ by Sebastian Kettley (The Express)
Russian fans are apparently unwilling to cede the title of world’s most out of control sports fan brawlers to English soccer fans at the world cup this summer. [Link; auto-playing video]
Taxes
Worried About Your Tax Bill? Hedge-Fund Star John Paulson Owes $1 Billion by Gregory Zuckman (WSJ)
Did you know that the largest possible sum that can be submitted to the IRS in one payment is $99,999,999? [Link; paywall]
Read Bespoke’s most actionable market research by starting a two-week free trial today! Get started here.
Have a great Sunday!
The Bespoke Report — 4/13/18
The Closer: End of Week Charts — 4/13/18
Looking for deeper insight on global markets and economics? In tonight’s Closer sent to Bespoke clients, we recap weekly price action in major asset classes, update economic surprise index data for major economies, chart the weekly Commitment of Traders report from the CFTC, and provide our normal nightly update on ETF performance, volume and price movers, and the Bespoke Market Timing Model. We’ve recently added a section that helps break down momentum in developed market foreign exchange crosses as well.
Below is a snapshot from today’s Closer highlighting weekly intraday price charts for major equity indices and other asset classes. If you’d like to see more, start a free trial below.

The Closer is one of our most popular reports, and you can sign up for a free trial below to see it!
See tonight’s Closer by starting a two-week free trial to Bespoke Institutional now!
Bespoke Sector Weightings Report — April 2018
S&P 500 sector weightings are important to monitor. Over the years when weightings have gotten extremely lopsided for one or two sectors, it hasn’t ended well. Below is a table showing S&P 500 sector weightings from the mid-1990s through 2016. In the early 1990s before the Dot Com bubble, the US economy was much more evenly weighted between manufacturing sectors and service sectors. Sector weightings were bunched together between 6% and 14% across the board. In 1990, Tech was tied for the smallest sector of the market at 6.3%, while Industrials was the largest at 14.7%. The spread between the largest and smallest sectors back then was just over 8 percentage points.
The Dot Com bubble completely blew up the balanced economy, and looking back you can clearly see how lopsided things had become. Once the Tech bubble burst, it was the Financial sector that began its charge towards dominance. The Financial sector’s sole purpose is to service the economy, so in our view you never want to see the Financial sector make up the largest portion of the economy. That was the case from 2002 to 2007, though, and we all know how that ended.
Unfortunately we’ve begun to see sector weightings get extremely out of whack once again.
If you would like to see the most up-to-date numbers for S&P 500 sector weightings, simply start a two-week free trial to our Bespoke Premium or Bespoke Institutional service. Click back to this post once you’re signed up to see the numbers.

40 Largest Companies Reporting Earnings Next Week
Below is a snapshot of the 40 largest companies set to report earnings next week. For each stock, we show its current consensus EPS and revenue estimate, and we also show each stock’s historical EPS and revenue beat rate. (Additional earnings season info is available with a Bespoke Premium free trial.)
On Monday morning, Bank of America (BAC), Charles Schwab (SCHW), and M&T Bank (MTB) kick things off, while Netflix (NFLX) will be on everyone’s radar after the close. On Tuesday morning, we hear from big Dow 30 stocks like Johnson & Johnson (JNJ), UnitedHealth (UNH), and Goldman Sachs (GS). IBM is the biggest stock reporting on Tuesday after the close.
Morgan Stanley (MS) is one of the last big brokers to report on Wednesday morning, and then American Express (AXP) reports its Q1 numbers on Wednesday after the close. Thursday we’ll hear from Philip Morris Intl (PM), Taiwan Semi (TSM), Danaher (DHR), and PPG Industries (PPG), while on Friday morning we get numbers from a number of blue chips like Procter & Gamble (PG), General Electric (GE), Honeywell (HON), and Schlumberger (SLB).
Of the stocks listed below, JNJ, UNH, GS, ISRG, and LRCX have historically beaten EPS estimates the most often.
Start a two-week free Bespoke Premium trial to access our interactive earnings calendar.

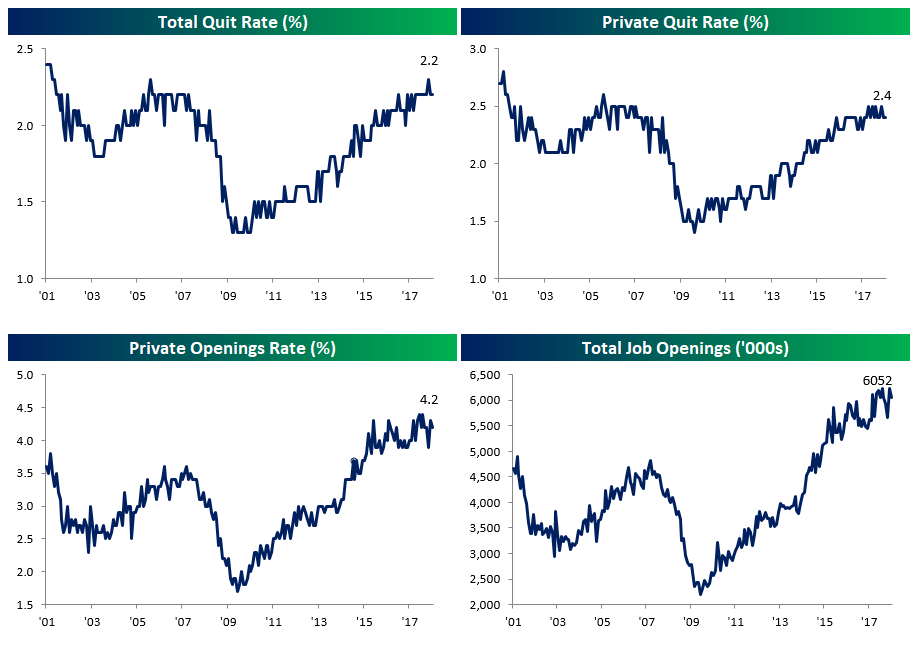
JOLTS Recap: Manufacturing Quits Explode
Today’s Job Opening and Labor Turnover Survey from the Bureau of Labor Statistics showed little change to the broad labor market picture. As shown in the charts below, the quit rate is very stable at round 2.2%. That rate is slightly higher for the private sector at 2.4% but as with the broad quit rate, private quits are basically moving sideways as a percentage of employment. The openings rate is also trending sideways. For the private sector, job openings are running higher than previous expansions at around 4.2%, or 6.05mm positions.
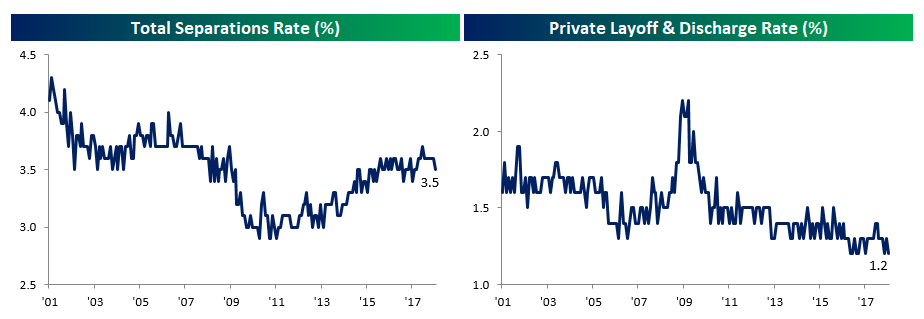
Unlike prior expansions, separations are relatively low, at only 3.5%. Part of that lower separations rate is the fact that layoffs are extremely rare at the moment, right at all-time lows (1.2%).
One final interesting tidbit is that the quits rate in the Manufacturing sector continues to surge. It’s at record levels, and continuing to move up, while total nonfarm and total private quits are rising but at a much, much slower pace.
The Closer — North America In Focus: Banxico, US Import Prices, Canada Housing — 4/12/18
Log-in here if you’re a member with access to the Closer.
Looking for deeper insight on markets? In tonight’s Closer sent to Bespoke Institutional clients, we review the Banxico policy decision, US import and export prices, soybean export data, and Canadian home prices.

See today’s post-market Closer and everything else Bespoke publishes by starting a 14-day free trial to Bespoke Institutional today!
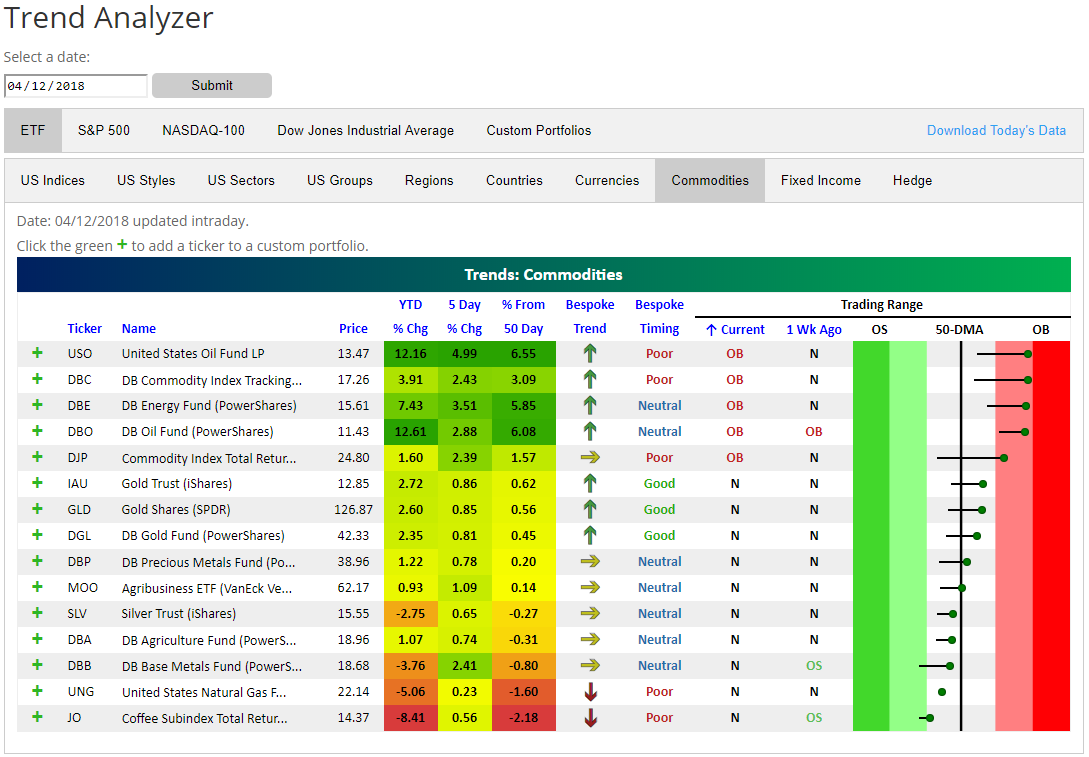
Commodities ETFs Surge
Commodities ETFs have been on a tear lately. Below is a snapshot from our Trend Analyzer tool. For each ETF, the dot in the trading range section represents where it’s currently trading within its range, while the tail end represents where it was trading one week ago. As shown, a number of commodities ETFs have now moved up into overbought territory, with USO (oil) and DBC (broad commodities) the most overbought.
While some commodities ETFs remain below their 50-day moving averages, they’re all up over the last week. Year-to-date, oil is up the most with a gain of 12%, while coffee (JO) is down the most at 8.4%.
Our Trend Analyzer tool lets you monitor trend and timing measures for all US stocks and major ETFs across asset classes. It’s accessible via a Bespoke Premium or Bespoke Institutional membership.
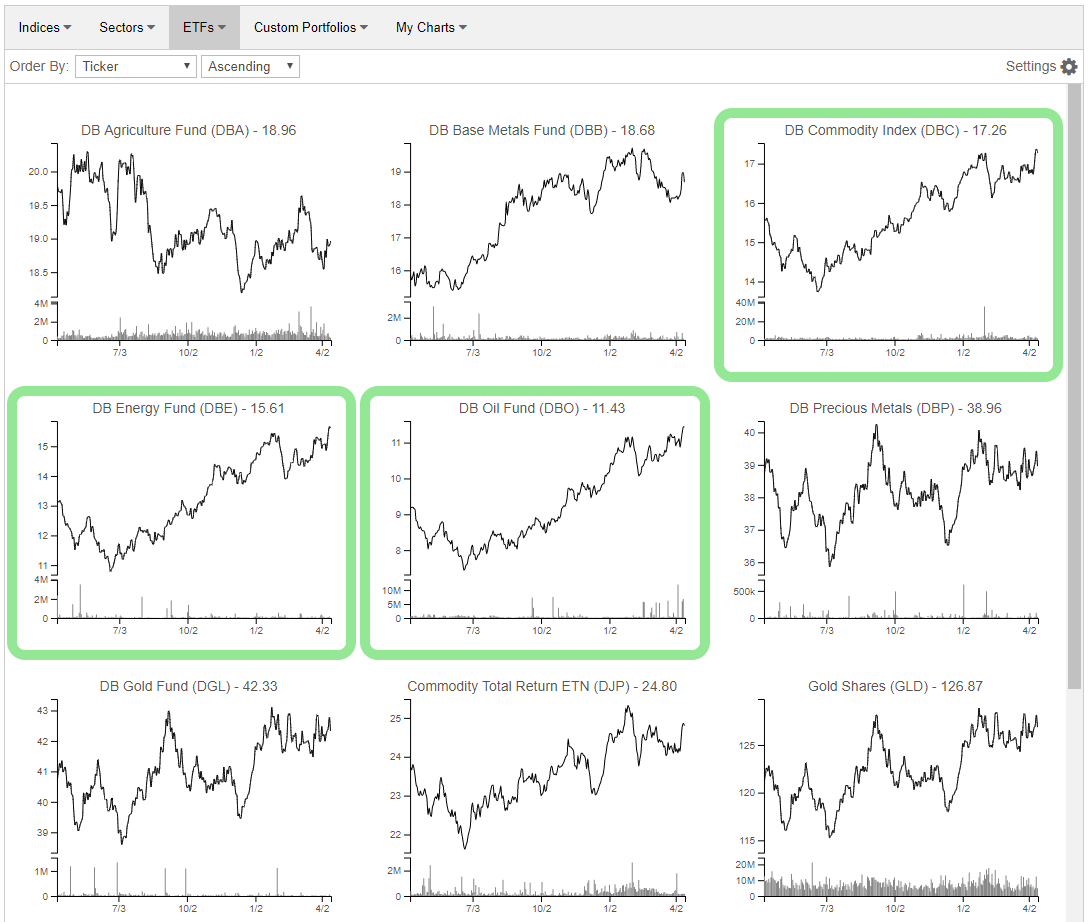
After viewing general trend and timing measures for commodities ETFs in our Trend Analyzer, we can dive deeper by viewing price charts of them in our popular Chart Scanner tool. Our Chart Scanner lets users browse through charts across asset classes quickly and easily. When you see a chart you like, click on it once to tag it as bullish. When you see a chart you don’t like, simply click on it twice to tag it as bearish. Below is a snapshot of nine commodities ETFs taken from our Chart Scanner. We’ve marked a few commodities ETFs as bullish because they’ve recently broken out to new one-year highs. The three that are marked are DBC, DBE, and DBO. If you had done this in our Chart Scanner, these three charts would now show up in your “Bullish” section under the “My Charts” tab.
To start tagging bullish and bearish charts in our Chart Scanner, simply sign up for a two-week free trial to Bespoke Premium. You’ll love this new feature!
Bespoke’s Sector Snapshot — 4/12/18
We’ve just released our weekly Sector Snapshot report (see a sample here) for Bespoke Premium and Bespoke Institutional members. Please log-in here to view the report if you’re already a member. If you’re not yet a subscriber and would like to see the report, please start a two-week free trial to Bespoke Premium now.
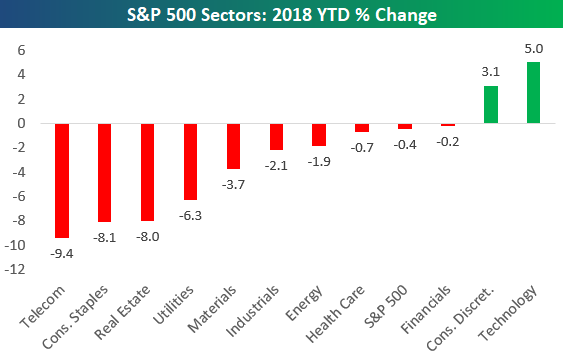
Below is one of the many charts included in this week’s Sector Snapshot, which highlights the year-to-date percentage change for the S&P 500 and its eleven sectors. As shown, the S&P is just barely in the red, but there are way more negative sectors than positive ones, which is indicative of weak breadth.
To find out what this means and to see our full Sector Snapshot with additional commentary plus six pages of charts that include analysis of valuations, breadth, technicals, and relative strength, start a two-week free trial to our Bespoke Premium package now. Here’s a breakdown of the products you’ll receive.