Bespoke Stock Scores — 4/24/18
US Index ETFs in a Neutral State of Mind
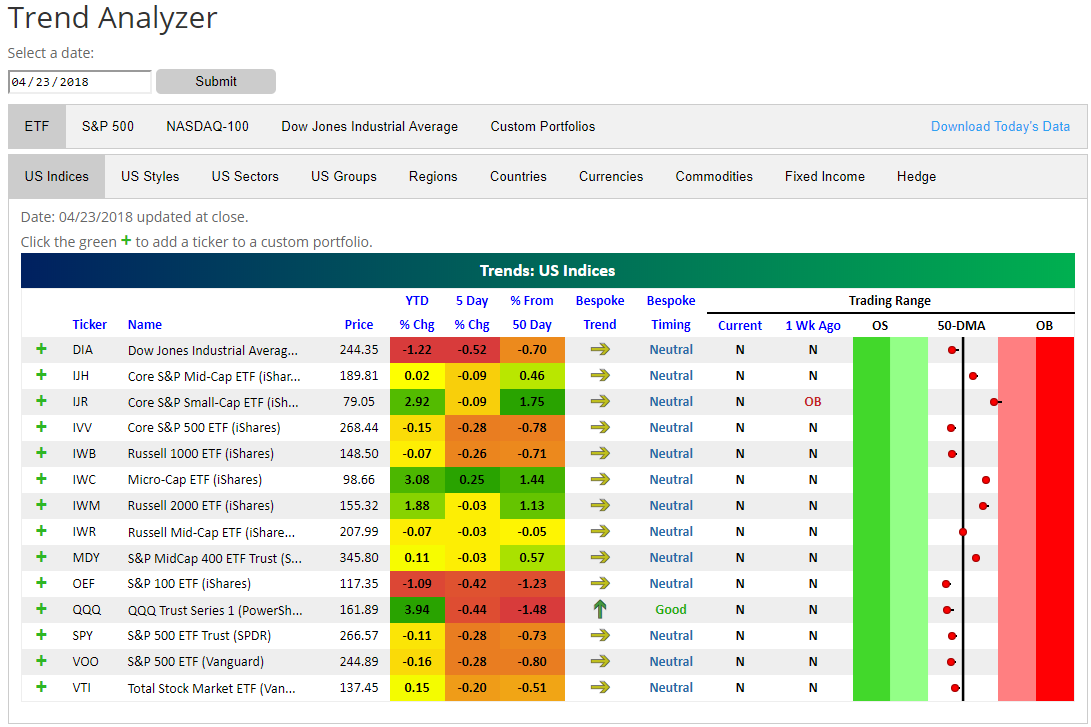
In browsing through our Trend Analyzer tool as we do each day, we noticed that US index ETFs are in a surprisingly neutral state of mind. After all of the volatility over the past few months, every single one of the index ETFs that we track in our Trend Analyzer are trading in neutral territory, which means they’re all within one standard deviation above or below their 50-day moving averages.
You can see the index ETFs in the snapshot of our Trend Analyzer below. (You can view it for yourself at our Trend Analyzer tool as well.) In the “trading range” section on the right side of the tool, the dots represent where the different ETFs are currently trading relative to their 50-day moving averages. As shown, none of the ETFs are trading in overbought or oversold territory, and last week at this time, only one ETF was in overbought territory.
At this point, the large-cap index ETFs are below their 50-day moving averages, while the mid-cap and small-cap ETFs are mostly above their 50-DMAs.
Proceed to our Trend Analyzer now for a further explanation of the tool and how we like to use it. The “US Indices” tab is available to the public, but to access the rest of the tool and set up custom portfolios, you’ll need to start a two-week free trial to Bespoke Premium.
The Closer — Expensive Earnings Yield, US Data Round Up, FX Stories — 4/23/18
Log-in here if you’re a member with access to the Closer.
Looking for deeper insight on markets? In tonight’s Closer sent to Bespoke Institutional clients, we take a look at new US Census estimates for the growth of the population. We also update our tracking of Canadian monthly GDP and recap some minor data releases from the US today: the Chicago Fed’s National Activity Index, Markit’s flash Manufacturing PMI, and existing home sales.

See today’s post-market Closer and everything else Bespoke publishes by starting a 14-day free trial to Bespoke Institutional today!
Chart of the Day: Dollar Spikes
Looking for Action? S&P 1500 Most Volatile Stocks
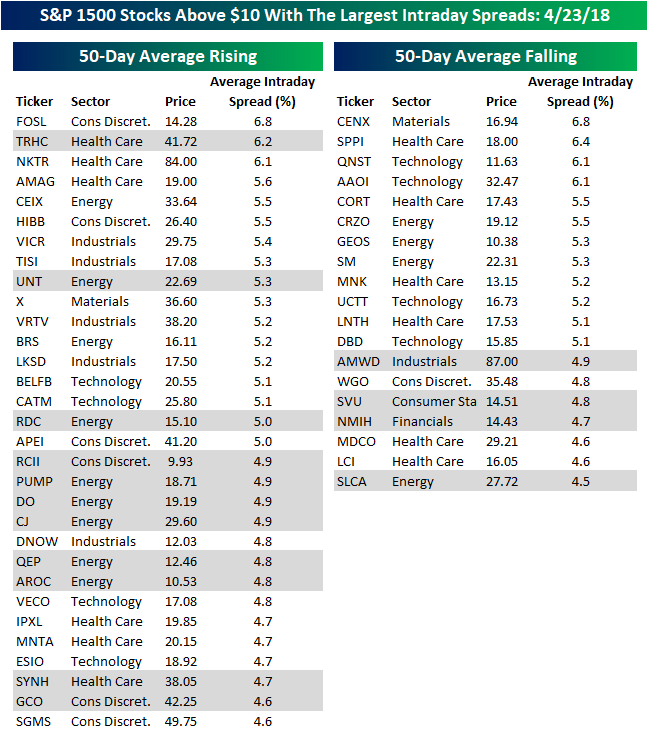
For traders with a short-term time horizon looking for big moves, we have updated our list of the S&P 1500 stocks trading above $10 that have the largest intraday high-low ranges (based on the average percent spread between the intraday high and low over the last 50 days). The stocks are grouped based on whether they have a rising or falling 50-day moving average (DMA), and 15 names highlighted in gray are new to the list this month.
In terms of sector representation, stocks on the list come from eight of the eleven S&P sectors. The only three sectors not represented are Real Estate, Telecom Services, and Utilities. Of the sectors on the list, Energy (13) and Health Care (12) take up the lion’s share of names listed with a total of 25.
As far as individual stocks are concerned, the highest priced stock on the list is American Woodmark (AMWD), which is trading at $87. With an average daily range of 4.9%, the stock typically sees an intraday swing of over $4 per share. While AMWD trades in the $80s, most of the stocks on our list are much lower priced. In fact, the average price of the 25 stocks listed is just slightly more than $25 per share.
Over time, the longer the market continues to trade in a sideways range as it has for the last several weeks, the more balanced the list of stocks in uptrends and downtrends will become. As it stands now, though, the number of stocks in uptrends (rising 50-DMA) outnumbers the number in downtrends (falling 50-DMA) by a comfortable margin of 31-19.
Bottom Line Beat Rates Strong, But Top Line A Different Story
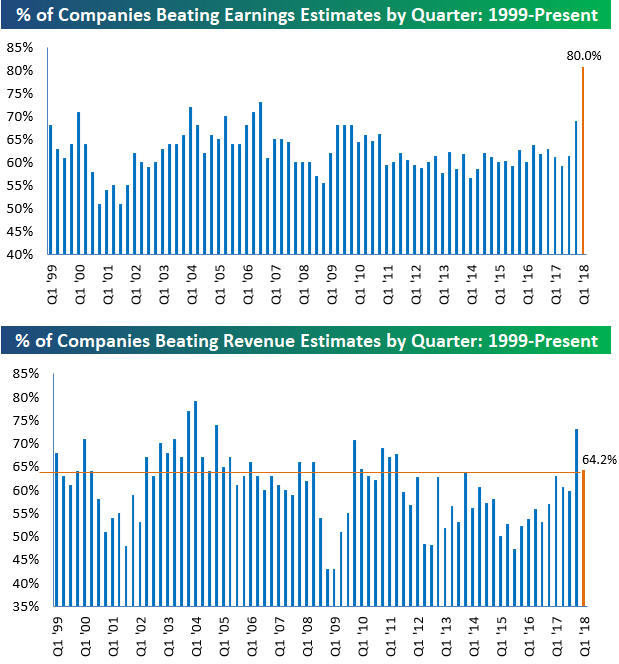
In last Friday’s Bespoke Report newsletter, we provided our first rundown of this season’s earnings results. While only 10-15% of companies have reported so far, it’s still enough to give us an early read on how companies performed in Q1. Below are two charts we thought we’d share more broadly with Think B.I.G. readers. In the first chart, we show the percentage of companies that have beaten consensus analyst EPS estimates on a quarterly basis going back to 1999. So far this season, 80% of companies that have reported have beaten EPS estimates. If that reading were to stand — and note that we don’t expect it to stand — it would be the strongest earnings beat rate seen in at least 19 years. Needless to say, companies have been beating EPS estimates at a historic clip so far this season.
In the second chart below, we show the percentage of companies that have exceeded consensus top-line revenue estimates on a quarterly basis. In terms of revenues, the beat rate looks much different this season compared to earnings. Only 64.2% of companies have beaten revenue estimates, which is nearly 16 percentage points below the EPS beat rate. If we had to choose, we’d prefer the top-line beat rate to be stronger than the bottom-line beat rate, because sales are harder for companies to manipulate. Last earnings season we actually saw a stronger revenue beat rate than earnings beat rate, but the opposite has been the case so far this season.
Start a two-week free trial to Bespoke Premium for access to all of our in-depth earnings season analysis.
Something for Everyone in Upcoming Seasonal Trends
Our interactive Stock Seasonality Tool (available to Bespoke Premium and Bespoke Institutional members) allows investors to quickly analyze and track seasonal tendencies for any asset class. It’s an incredibly useful tool that we added for clients earlier this year. Looking at the Seasonality Tool earlier today, we noticed that depending on your time frame, there’s a little something for everyone.
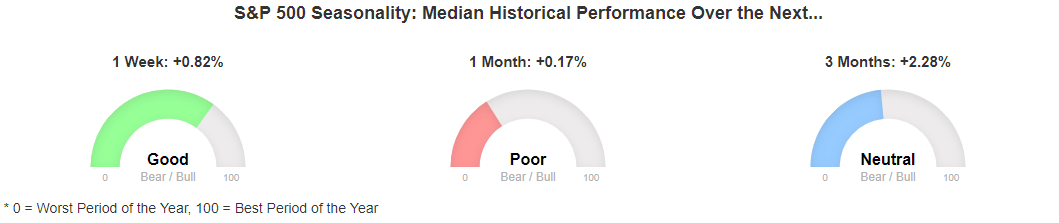
The graphic below shows the S&P 500’s median one-week, one-month, and three-month returns (from today’s closing level) based on the last ten years of data. In the short term, the S&P 500’s median performance in the one-week period from the close on 4/23 through month end has been an impressive +0.82%, which is better than average compared to other one-week periods over the last ten years. While median returns in the very short-term have been good, the S&P 500’s median one-month return from the close on 4/23 has been a paltry 0.17%, which ranks as poor relative to all other one-month periods over the last ten years. Finally, looking out over the next three months, the S&P 500 has seen a median gain of 2.28%. That sounds respectable enough, but when you consider the fact that most of that time has been during a bull market, 2.28% only ranks as neutral relative to median three-month returns for all other periods throughout the year.
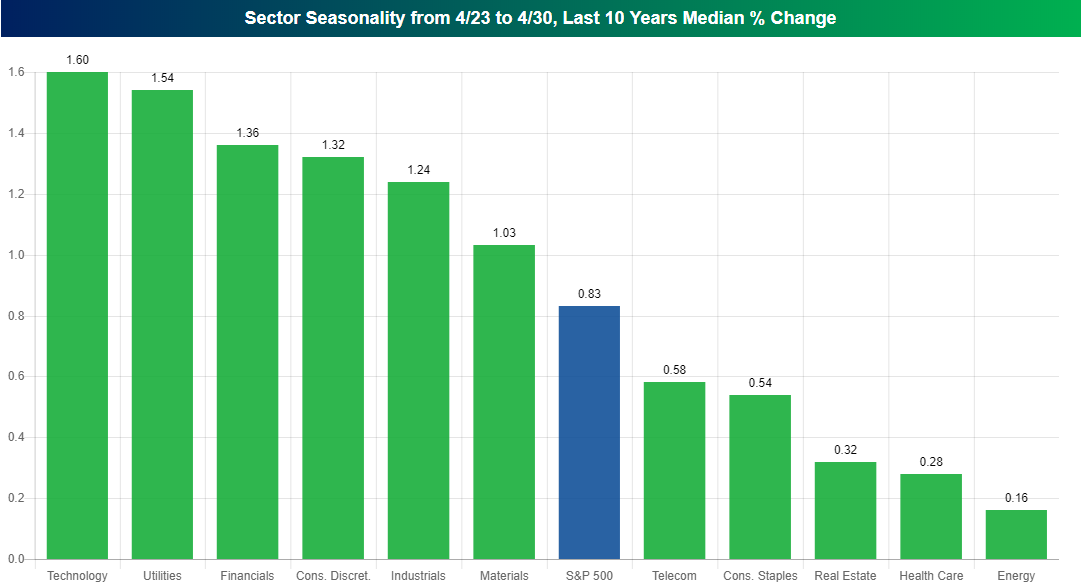
Looking more closely at just the next week, the chart below is also from our Stock Seasonality Tool, and it shows the median performance of S&P 500 sectors over the upcoming week. Leading the way higher, Technology has historically seen a median gain of 1.6% during the last week of April, but another five sectors (Utilities, Financials, Cons Discretionary, Industrials, and Materials) have seen median gains of more than 1%. While no sectors have seen declines on a median basis, Energy (+0.16%) and Health Care (+0.28%) have been the biggest laggards.
Again, both the chart below and the graphic above our from our Stock Seasonality Tool (available to Bespoke Premium and Bespoke Institutional members) and can be customized by time frame as well as different market cap sizes, asset classes, etc. Not only that, but you can also track seasonal trends for the stocks or ETFs in any custom portfolios you have created. Give it a try!
Key Earnings Reports to Watch This Week (4/23-4/27)
This week will be the busiest yet this reporting period when it comes to earnings releases. As we do throughout the key six-week stretch of earnings season, below is a list of the 40 largest companies set to release Q1 2018 numbers this week. For each stock, we provide its expected report date and time, its consensus analyst EPS and revenue estimate, its historical EPS and revenue beat rate, and its average one-day share price change (%) in response to its historical quarterly reports. All of this data is pulled from our popular Earnings Screener that’s available to Bespoke Institutional members.
Monday’s main report to watch is Alphabet (GOOG) after the close. The stock is currently projected to earn $12.04/share and post revenues of $24.5 billion. Historically, GOOG has beaten consensus EPS estimates 68.5% of the time and exceeded revenue estimates 72.2% of the time. On average, GOOG sees a gain of +1.80% on its earnings reaction day (which will be tomorrow’s trading day in this case).
Tuesday is a huge day for blue-chip Dow Jones Industrial Average companies. In the morning, we’ll hear from five Dow members: Verizon (VZ), Coca-Cola (KO), 3M (MMM), United Tech (UTX), and Caterpillar (CAT). Of these five, UTX beats EPS the most often at 92.4%, and it also averages the best one-day returns at +0.75%. Amgen (AMGN), Texas Instruments (TXN), and Chubb (CB) all report on Tuesday after the close.
Wednesday’s key reports include Boeing (BA) in the morning, and then Facebook (FB), Visa (V), and Qualcomm (QCOM) after the close. Facebook’s numbers might be the most closely followed of any company this season given all the attention it has been paid over the last couple of months. Historically, FB has beaten EPS and revenue estimates 95.7% of the time, and it has averaged a gain of 3.45% on its past earnings reaction days. Needless to say, investors have become accustomed to strong earnings from FB.
Thursday’s biggest reports come after the close when Amazon (AMZN), Microsoft (MSFT), Intel (INTC), and Starbucks (SBUX) post Q1 numbers. These four companies combined are projected to post revenues of $90 billion.
Finally, Exxon Mobil (XOM) and Chevron (CVX) — the two main Dow 30 Energy stocks — both close out the busy week with reports on Friday before the open.
Bespoke Premium is an excellent resource during earnings season. Along with daily commentary, the service includes access to our interactive Earnings Calendar and our updated list of earnings triple plays. Start a two-week free trial to try it out for yourself!

2018 Global Stock Market Performance YTD
Below is a look at the 2018 YTD performance of 76 country stock markets around the world. For each country, we generally use its most widely quoted stock market index, and returns are shown in local currencies.
The average year-to-date performance of the 76 countries shown is a gain of 1.66%. Of the 76 countries, 44 are up, while 32 are down. Note that five of the seven “G7” developed countries are performing in the bottom half of the group, with only Italy and France ranking in the top half. The US ranks 44th out of 76 with a near flat-line change of +0.02% on the year. Of the remaining G7 countries, Japan, Germany, the UK, and Canada are all in the red by -2.9% or more.
Just six countries have posted gains of more than 10% on the year, with Ukraine leading the way at +17.78%. Bermuda, Romania, Saudi Arabia, Pakistan, and Brazil round out the top six. There are eight countries down more than 5%, with the Philippines, Dubai UAE, and China at the bottom of the list.

Bespoke Brunch Reads: 4/22/18
Welcome to Bespoke Brunch Reads — a linkfest of the favorite things we read over the past week. The links are mostly market related, but there are some other interesting subjects covered as well. We hope you enjoy the food for thought as a supplement to the research we provide you during the week.
Tech Dystopia
Palantir Knows Everything About You by Peter Waldman, Lizette Chapman, and Jordan Robertson (Bloomberg)
After a JPMorgan team that partnered with data analytics company Palantir went rogue, the company curtailed use of the firm’s services. What makes this concerning is the fact that Palantir also partners with law enforcement around the country, providing police a potentially egregious weapon that can be misused. [Link]
The latest trend for tech interviews: Days of unpaid homework by Melissa McEwen (Quartz)
Tech companies are taking to assigning large batches of work as evidence that potential hires are competent. [Link]
Arrogance Peaks in Silicon Valley by M. G. Siegler (500ish Words)
A righteous and warranted polemic against the insulated bubble of ideas that Silicon Valley has become, out of touch and impatient with society as a whole. [Link]
Tech Utopia
The End of the Joint As We Know It by Alyssa Bereznak (The Ringer)
With former Speaker of the House John Boehner partnering with a marijuana comapny and Senate Minority Leader Schumer calling for national legalization this week, the war on weed appears to be winding down. Get ready for a wave of new ways to imbibe the intoxicant. [Link]
Robot Conquers One of the Hardest Human Tasks: Assembling Ikea Furniture by Niraj Chokshi (NYT)
A robot has successfully assembled a piece of furniture from Ikea, achieving what we ourselves have failed at before and offering a vision of a world without Swedish instructions. [Link; soft paywall, auto-playing video]
Stinks To High Heaven
The UK Refused To Raid A Company Suspected Of Money Laundering, Citing Its Tory Donations by Heidi Blake, Tom Warren, Richard Holmes, and Jane Bradley (Buzzfeed)
In a bombshell piece of investigative reporting, Buzzfeed details a decision not to raid a company despite evidence of wrongdoing because they are a donor to the current government’s party and a charity linked to the Royal Family. [Link]
A Train Full of Poop From New York Is Stranded in a Tiny Alabama Town by Jeff Martin and Jay Reeves (Bloomberg/AP)
New York exports human waste thanks to a federal ban on dumping into oceans, and one train carrying a load of that export is currently stranded to the dismay of a small Alabama town. [Link]
Sports
As Teams Seek More Relief, 13-Man Pitching Staffs Are the New Normal by Jared Diamond (WSJ)
The days of the complete game are long gone, as high pitch speeds and freakishly talented hitters have eroded the starter’s ability to go deep into the later innings. Now, shifts in strategy are again pushing up the number of relief pitchers necessary for a team to function. [Link; paywall]
Everyone Wants To Go Home During Extra Innings — Maybe Even The Umps by Michael Lopez and Brian Mills (538)
By the time innings stretch to double-digits, umpires start to get ready for the end of the game just like the rest of us. [Link]
How the Boston Marathon’s Runner-Up Shocked the Running World by Sara Germano (WSJ)
The first American woman in 33 years won the Boston Marathon, and her story is remarkable: mid-twenties, unknown, unsponsored, and running her second marathon ever. Her story is one of grit more than extreme athletic ability, arguably making it all the more impressive. [Link]
Metals
Treasure island: Rare metals discovery on remote Pacific atoll is worth billions of dollars by Chris Ciaccia (Fox News)
So-called “rare earths” aren’t actually that “rare” but they are certainly valuable and a discovery on a tiny Japanese atoll has been heralded as a game changer worth billions. [Link]
Russia Sanctions Throw Global Aluminum Industry Into Chaos by Thomas Biesheuvel and Jack Farchy (Bloomberg)
Sanctions on Russia’s United Co. Rusal have led to major disruptions in the global aluminum value chain; the company produces both inputs and final outputs, making the entire thing quite a mess. [Link; auto-playing video]
Helpful Hints
27 Incredibly Useful Things You Didn’t Know Chrome Could Do by JR Raphael (Fast Company)
Pretty much exactly what it says on the tin: helpful productivity tips for the ubiquitous Google web browser. [Link]
Publishing
Why All My Books Are Now Free (Aka A Lesson In Amazon Money Laundering) (Meb Faber)
An interesting post describing the litany of non-publisher booksellers on Amazon and how they may be used for money laundering. [Link]
Taxes
Americans Spent Record Amounts on Accounting Fees Last Year by Alexandre Tanzi and Vincent Del Giudice (Bloomberg)
Tax preparers of various types hauled in $44bn in revenue in Q4, working out to roughly $135 per person. [Link]
Dining
The Quarterback of the Kitchen? It’s Not Always the Chef by Tejal Rao (NYT)
While the head chef gets the TV shows, the expediter is the real hero, making sure that the complicated dance of the kitchen staff stays in sync and that dishes get to tables quickly. [Link]
Read Bespoke’s most actionable market research by starting a two-week free trial today! Get started here.
Have a great Sunday!