Chart of the Day: Global Central Bank Balance Sheets Growing Slower
Bespoke’s Sector Snapshot — 6/14/18
We’ve just released our weekly Sector Snapshot report (see a sample here) for Bespoke Premium and Bespoke Institutional members. Please log-in here to view the report if you’re already a member. If you’re not yet a subscriber and would like to see the report, please start a two-week free trial to Bespoke Premium now.
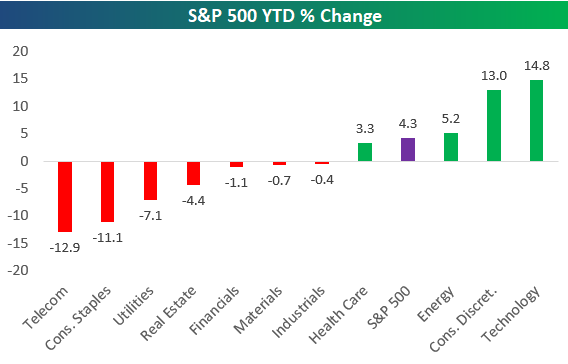
Below is one of the many charts included in this week’s Sector Snapshot, which shows the YTD percentage change of the eleven S&P 500 sectors. As shown, Technology and Consumer Discretionary are currently in a race for first place, with Tech currently in the lead and Consumer Discretionary right on Tech’s heels.
To find out what this means and to see our full Sector Snapshot with additional commentary plus six pages of charts that include analysis of valuations, breadth, technicals, and relative strength, start a two-week free trial to our Bespoke Premium package now. Here’s a breakdown of the products you’ll receive.
Four-Month High In Bullish Sentiment
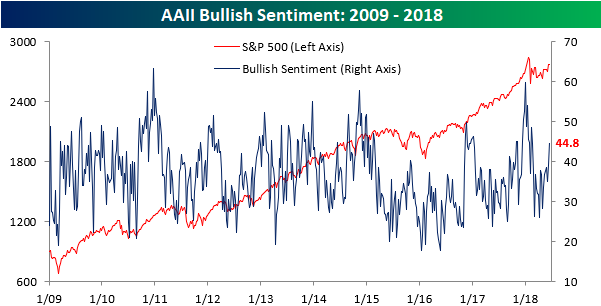
Bulls are on the offensive this week as AAII Bullish sentiment jumped to 44.78% from 38.93% last week, which is the highest level since mid-February. Bullish sentiment had been gradually trending higher in recent weeks, but this week’s jump represents a breakout from that pace.
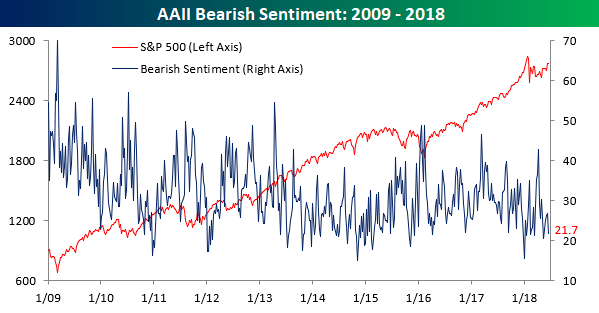
While bullish sentiment spiked higher, bearish sentiment did not see as big of a move to the downside. As shown in the chart below, negative sentiment declined from 26.72% down to 21.70%. That’s only the lowest reading since mid-May.
the Bespoke 50 — 6/14/18
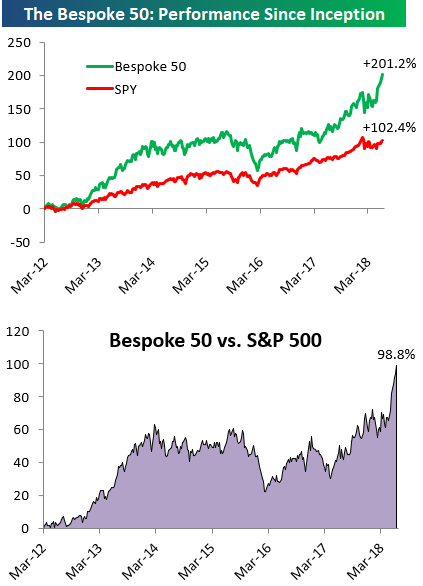
Every Thursday, Bespoke publishes its “Bespoke 50” list of top growth stocks in the Russell 3,000. Our “Bespoke 50” portfolio is made up of the 50 stocks that fit a proprietary growth screen that we created a number of years ago. Since inception in early 2012, the “Bespoke 50” has beaten the S&P 500 by 98.8 percentage points. Through today, the “Bespoke 50” is up 201.2% since inception versus the S&P 500’s gain of 102.4%. Always remember, though, that past performance is no guarantee of future returns.
To view our “Bespoke 50” list of top growth stocks, click the button below and start a trial to either Bespoke Premium or Bespoke Institutional.
The Closer — Fed Hikes, PPI Spikes, EIA Improvement — 6/13/18
Log-in here if you’re a member with access to the Closer.
Looking for deeper insight on markets? In tonight’s Closer sent to Bespoke Institutional clients, we recap the Fed’s second hike of the year and the outlook now for four hikes across the next six months of 2018. We also review PPI and weekly EIA data.

See today’s post-market Closer and everything else Bespoke publishes by starting a 14-day free trial to Bespoke Institutional today!
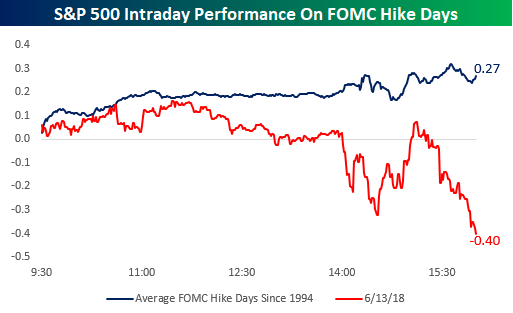
Not Your Typical FOMC Day
Without even getting into the crazy intraday swings we saw in emerging market indices like Brazil’s Ibovespa, today’s market action was not the type normally seen on days when the Fed hikes rates. The chart below compares today’s intraday performance of the S&P 500 to all other Fed rate hike days since 1994. As shown with the blue line in the chart, the S&P 500 has seen an average gain of 0.27% on historical rate hike days. On those days, the S&P 500 typically trades higher leading up to the announcement, then sees some volatility following the announcement, but ultimately finishes the day slightly higher than it was right before the decision was announced.
Today’s action was completely different. While the S&P 500 was up early in the trading day, it began to lose steam well before the 2 PM announcement and then saw a sharp intraday decline right after the announcement. From there, it looked like we were going to see a similar move to the typical FOMC hike day as the S&P 500 went back into the green shortly after 3 PM. Right after the S&P 500 moved into positive territory, though, the sellers stepped in, and we finished at the lows of the day with a decline of 0.40%. It’s never a good feeling to go out at the lows of the day, but tomorrow is another day!
You’re a What Investor???
B.I.G. Tips — Cat Nap
Fixed Income Weekly – 6/13/18
Searching for ways to better understand the fixed income space or looking for actionable ideals in this asset class? Bespoke’s Fixed Income Weekly provides an update on rates and credit every Wednesday. We start off with a fresh piece of analysis driven by what’s in the headlines or driving the market in a given week. We then provide charts of how US Treasury futures and rates are trading, before moving on to a summary of recent fixed income ETF performance, short-term interest rates including money market funds, and a trade idea. We summarize changes and recent developments for a variety of yield curves (UST, bund, Eurodollar, US breakeven inflation and Bespoke’s Global Yield Curve) before finishing with a review of recent UST yield curve changes, spread changes for major credit products and international bonds, and 1 year return profiles for a cross section of the fixed income world.
Today we review the recent uptick in spreads for investment grade credit.

Our Fixed Income Weekly helps investors stay on top of fixed income markets and gain new perspective on the developments in interest rates. You can sign up for a Bespoke research trial below to see this week’s report and everything else Bespoke publishes free for the next two weeks!
Click here and start a 14-day free trial to Bespoke Institutional to see our newest Fixed Income Weekly now!
Bespoke’s Global Macro Dashboard — 6/13/18
Bespoke’s Global Macro Dashboard is a high-level summary of 22 major economies from around the world. For each country, we provide charts of local equity market prices, relative performance versus global equities, price to earnings ratios, dividend yields, economic growth, unemployment, retail sales and industrial production growth, inflation, money supply, spot FX performance versus the dollar, policy rate, and ten year local government bond yield interest rates. The report is intended as a tool for both reference and idea generation. It’s clients’ first stop for basic background info on how a given economy is performing, and what issues are driving the narrative for that economy. The dashboard helps you get up to speed on and keep track of the basics for the most important economies around the world, informing starting points for further research and risk management. It’s published weekly every Wednesday at the Bespoke Institutional membership level.
You can access our Global Macro Dashboard by starting a 14-day free trial to Bespoke Institutional now!
