Domestics Shining As Dollar Rallies
As shown in the chart below, the US Dollar index is up 4% since it took off on April 16th.
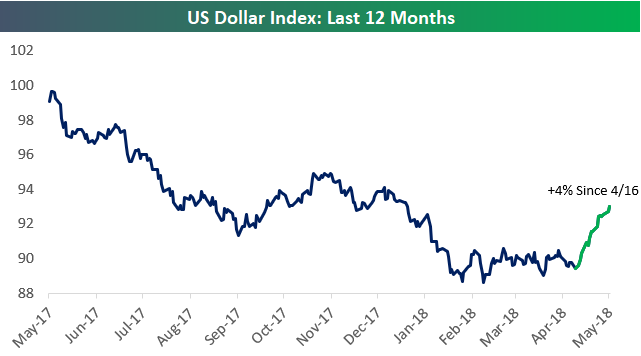
Dollar strength hurts US companies that generate significant revenues outside of the country, and it benefits companies that generate the bulk of their revenues domestically.
Since April 16th when the Dollar began its current rally, we’ve seen “domestic” stocks outperform “internationals” by a wide margin. Using our International Revenue Database that’s available to Bespoke Premium and Bespoke Institutional members, below we show that Russell 1,000 stocks that generate 50%+ of their revenues outside of the US are down an average of 1.21% since 4/16. On the flip side, Russell 1,000 stocks that generate all of their revenues domestically are up an average of 1.67% over the same time period.
This is clear evidence that the Dollar’s movements are impacting stock prices.
To find the geographic revenue exposure of stocks you’re most interested in, start a two-week free trial to Bespoke Premium and access our International Revenues Database now.
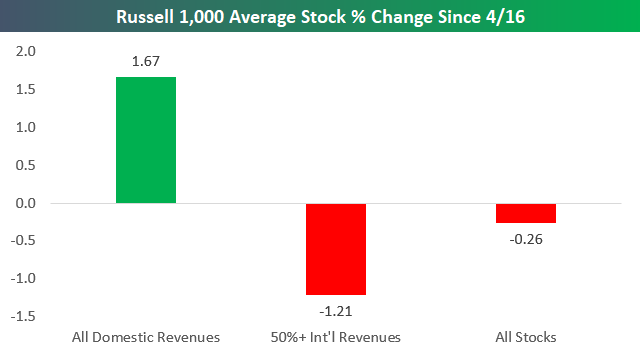
Chart of the Day – Small Business Sentiment Little Changed
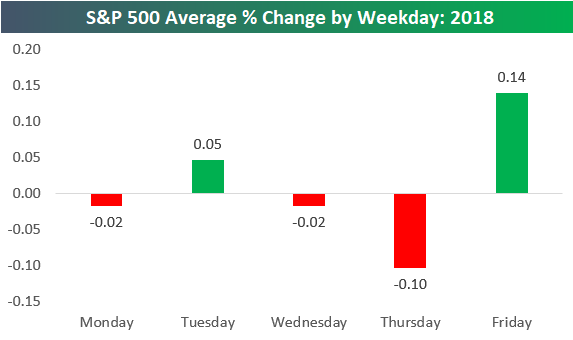
S&P 500 Average Performance by Weekday
The S&P 500 has averaged a daily change of 0.01% so far in 2018. That’s about as close to zero as it can get, but at least it’s positive!
Below is a chart showing the S&P 500’s average daily change by weekday so far in 2018. As shown, Monday, Wednesday, and Thursday have averaged declines, while Tuesday and Friday have averaged gains. Thursdays have been the worst day of the week, while Fridays have been the strongest.
In terms of volatility, the S&P has averaged an absolute change of +/-0.86% on all trading days so far in 2018. In 2017, which was one of the least volatile years in the history of the stock market, the S&P averaged an absolute daily change of just +/-0.30%.
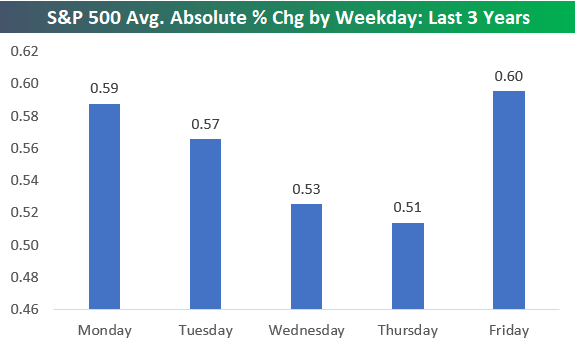
Below we show how volatile each trading day of the week has been in 2018. As shown, the week has started and ended with a bang, while the middle days have been less volatile. On Mondays, the S&P has averaged a move of +/-1.15%. Tuesdays and Thursdays have averaged smaller moves of just over +/-0.80%, while Wednesdays have been the least volatile with an average change of +/-0.51%. Finally, Fridays have ended the week with an average absolute change of +/-1.03%.

The trend of volatile starts and ends to weeks and a calmer tone during the middle of the week has been in place for more than just 2018. Looking back over the last three years, a similar pattern has been in place. Mondays and Fridays have been the most volatile days of the week, and then things have gotten progressively less volatile from Tuesday through Thursday.
Bespoke Stock Scores — 5/8/18
The Closer — Last Hour, Next 6 Months — 5/7/18
Log-in here if you’re a member with access to the Closer.
Looking for deeper insight on markets? In tonight’s Closer sent to Bespoke Institutional clients, we take a look at the last hour of trading versus the first hour, and what it means for forward returns. We also take a look at a couple solid data releases from Mexico today and the recession signal in the UST yield curve.

See today’s post-market Closer and everything else Bespoke publishes by starting a 14-day free trial to Bespoke Institutional today!
A Bipartisan Rally: Crude Oil and the Dollar
WTI crude oil prices crossed a major milestone when they traded above $70 per barrel for the first time since late 2014, when prices were crashing from over $100 to ultimately under $30. With the recent gains, crude oil prices are up over 16% YTD now and 52% over the last 12 months.
The most surprising aspect of the rally in crude oil prices is that the most recent leg higher has come as the dollar has rallied along with it. Historically, crude oil prices have had an inverse correlation to the dollar and looking at the chart below, it’s pretty easy to see that the rally in crude oil prices over the last year has mostly coincided with a decline in the dollar. Over the last four weeks, though, the US Dollar Index has seen a pretty sizable bounce of over 3%, but rather than stop the rally in its tracks, crude oil has been unfazed, gaining an additional 10%+.

We just published a report for clients looking at how equities have reacted following prior periods where crude oil and the dollar have rallied by similar magnitudes on a simultaneous basis. After going through this must-read report, you may be surprised to see just how uncommon a scenario like this is. To see the report, sign up for a monthly Bespoke Premium membership now!
S&P 500’s Daily Move Back Below 1%
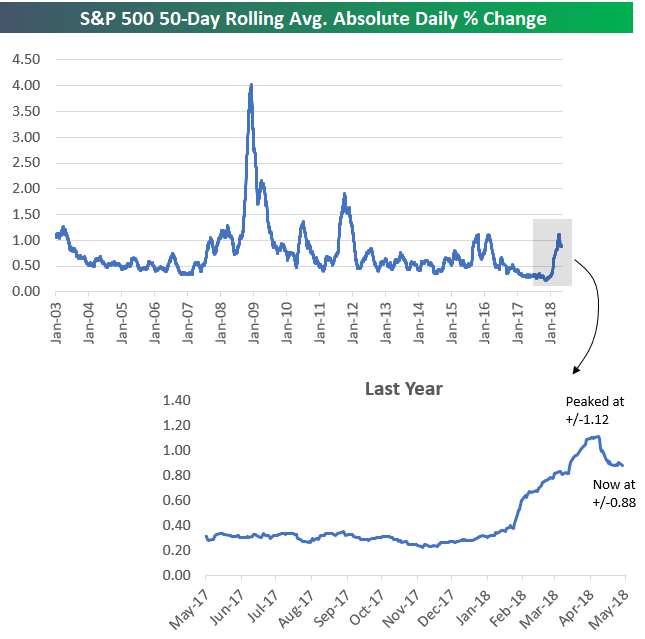
As you may have noticed, market volatility has begun to cool a bit in recent weeks. While we wouldn’t go as far as famed investor Jack Bogle did when he said recently that it’s the most volatile market he’s seen in his career, the action over the first few months of 2018 was certainly a lot more hectic than it was in 2017. At one point last year, the S&P 500’s average absolute daily % change over a 50-trading day period got as low as 0.22%! At its highs recently on April 16th, the S&P had averaged a daily absolute change of +/-1.12% over the prior 50 trading days.
Below is a chart showing the S&P’s 50-day rolling average absolute daily % change going back to 2003. The most recent period ended up trading more volatile than the action we saw in 2015/2016, but it wasn’t nearly as volatile as late 2011 when the S&P averaged a daily move of +/-1.98% over a 50-day period.
Of course, nothing since the Great Depression can compare to the volatility seen at the height of the Financial Crisis. At one point in late 2008, the S&P had averaged a DAILY move of +/-4.02% over a 50 trading day period. Now THAT is what you call “the most volatile market you’ve ever seen!”
Getting back to the current market environment, after peaking at +/-1.12% in mid-April, the S&P’s average daily change over the last 50 days has dipped down to +/-0.88%. While it may feel like things have calmed down, +/-0.88% is still 4x greater than what investors were used to in 2017.
Key Earnings Reports This Week
We’re now past the peak of the Q1 earnings reporting period, and the # of companies reporting each day will trickle lower and lower over the next few weeks. While most of the mega-cap companies that every investor pays attention to have already reported their Q1 numbers, there are still plenty of key companies that have yet to have their quarterly day in the sun (or in the storm).
Our Earnings Calendar is a very useful resource for investors looking to stay on top of quarterly earnings for the stocks they’re interested in. Users can enter specific stock tickers to find key earnings info like expected report date and time, EPS and revenue estimates, historical beat rates for EPS, revenues, and guidance, and historical stock price reactions. You can also see all earnings reports expected on a given day or during a given week over the next month.
Below is a screenshot of the Earnings Calendar showing the companies reporting this week with the largest Q1 revenue estimates. As shown, Walt Disney (DIS) is on top with estimated revenues of over $14 billion for the quarter. DIS reports tomorrow after the close, and it has historically beaten EPS estimates 80% of the time.
Some other key companies to watch this week include Anheuser-Busch InBev (BUD) on Wednesday morning, Enbridge (ENB) on Thursday morning, 21st Century Fox (FOXA) on Wednesday afternoon, and Marriot (MAR) tomorrow afternoon.
The Earnings Calendar is part of our Bespoke Premium research service. Start a two-week free trial to Bespoke Premium now for access.
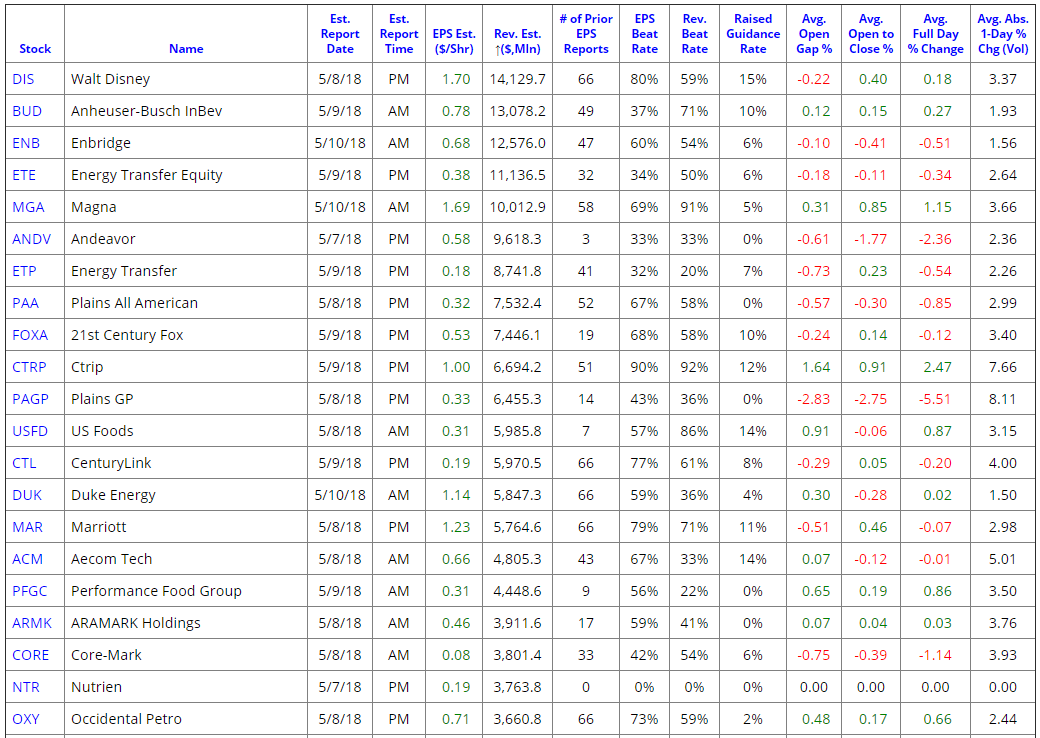
Chart of the Day: Oil Over $70 = Risk Or Opportunity?
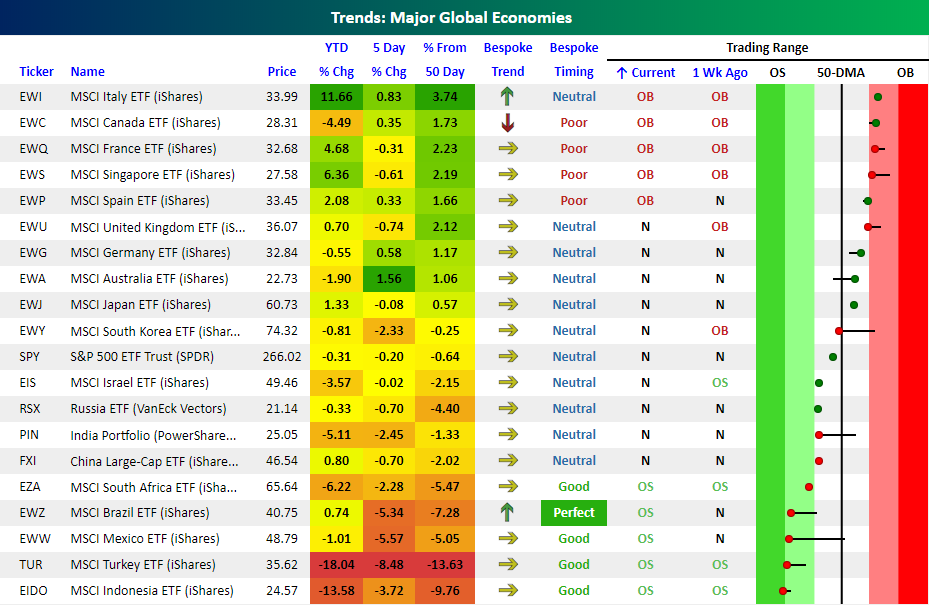
Mixed Global Bag
The image below is from our Trend Analyzer tool and shows a custom portfolio we created that tracks where the ETFs of the 20 largest global economies currently stand relative to their trading ranges. Keep in mind that the returns for each ETF are in US dollars and therefore account for any strength/weakness in the dollar. As shown on the right side of the snapshot, global stock markets are somewhat of a mixed bag as we enter the first full week of May. Currently, five countries are overbought (Italy, Canada, France, Singapore, and Spain), ten are neutral, and five are oversold (South Africa, Brazil, Mexico, Turkey, and Indonesia). All five overbought ETFs are from developed markets, while the five oversold ETFs are all from emerging markets, so that is one trend worth highlighting. Also worth pointing out is that of the five oversold ETFs, four have “Good” Bespoke Timing Scores, while Brazil even ranks as “Perfect”.
In terms of performance metrics, the majority of ETFs listed below are down YTD with an overall average decline of 1.4%. Leading the way to the downside are Turkey, Indonesia, South Africa, and India (again, all emerging economies), while Italy and Singapore are the only ETFs up over 5% YTD. With the S&P 500 entering the week down 0.3% YTD, it’s right in the middle of the pack versus the rest of the world and just below its 50-day moving average.
Set up your own custom Trend Analyzer portfolios by starting a two-week free trial to Bespoke Premium now!