Chart of the Day: Housing Starts Remain Solid
S&P 500 Trailing 12-Month P/E Ratio
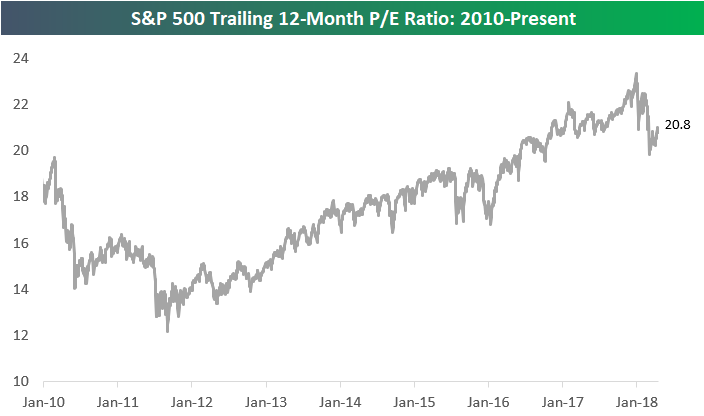
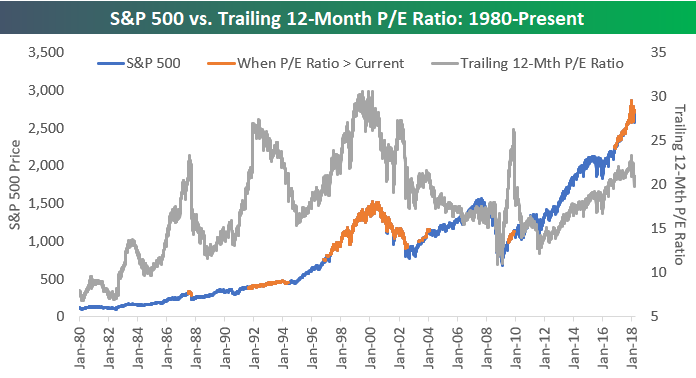
As of yesterday, the S&P 500’s trailing 12-month P/E ratio stood at 20.8. The high point for the S&P’s P/E ratio for the current bull market was 23.34 hit on January 26th, which was the same day the index made its last all-time high in price. Since those highs, the P/E has contracted by 2.54 points.
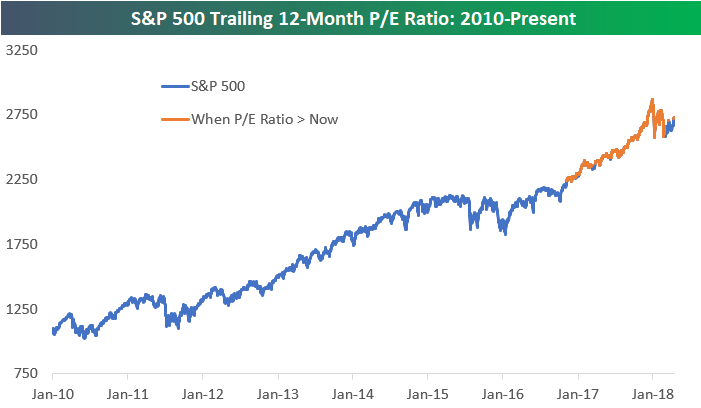
Below is a chart of the S&P 500’s price since 2010. The orange line represents periods when the S&P 500’s P/E ratio has been higher than it is now (>20.80). As shown, the index basically traded at a higher valuation than now for the entirety of 2017’s big rally.
Below we show the S&P 500’s price vs. P/E ratio going back to 1980. Once again, the S&P’s price is highlighted in orange when the index’s P/E ratio has been greater than 20.8. As shown, the S&P traded at a higher valuation than now from 1992 through early 1994 and again from mid-1997 through early 2002. During the 2003-2007 bull market, we actually saw P/E contraction that kept it below 20 up until the index peaked in October 2007.
Bespoke’s Global Macro Dashboard — 5/16/18
Bespoke’s Global Macro Dashboard is a high-level summary of 22 major economies from around the world. For each country, we provide charts of local equity market prices, relative performance versus global equities, price to earnings ratios, dividend yields, economic growth, unemployment, retail sales and industrial production growth, inflation, money supply, spot FX performance versus the dollar, policy rate, and ten year local government bond yield interest rates. The report is intended as a tool for both reference and idea generation. It’s clients’ first stop for basic background info on how a given economy is performing, and what issues are driving the narrative for that economy. The dashboard helps you get up to speed on and keep track of the basics for the most important economies around the world, informing starting points for further research and risk management. It’s published weekly every Wednesday at the Bespoke Institutional membership level.
You can access our Global Macro Dashboard by starting a 14-day free trial to Bespoke Institutional now!

The Closer — Pricing Power, TIC’d, ARS — 5/15/18
Log-in here if you’re a member with access to the Closer.
Looking for deeper insight on markets? In tonight’s Closer sent to Bespoke Institutional clients, we recap recent happenings in Argentina, flows into and out of the US securities markets by international investors, and data from the NY Fed with corporate profits implications.

See today’s post-market Closer and everything else Bespoke publishes by starting a 14-day free trial to Bespoke Institutional today!
B.I.G. Tips – Most Loved and Hated Stocks
Chart of the Day: BJ’s Restaurants (BJRI)
B.I.G. Tips – Retail Sales Mixed
Empire Manufacturing Report Better Than Expected
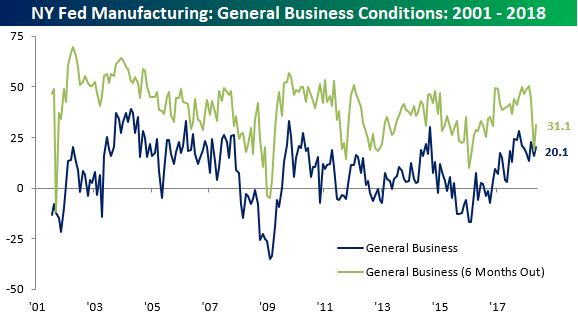
Tuesday’s release of the Empire Manufacturing report for the month of May came in better than expected with the headline index rising back up to 20.1 from last month’s level of 15.8. Economists, meanwhile, were looking for a modest decline. You may recall that in last month’s report, we saw expectations for conditions six-months from now come crashing down, but this month they saw a bit of a rebound. Even after the bounce, though, the expectations components of the headline index and each sub-sector are still well off their levels from two months ago.
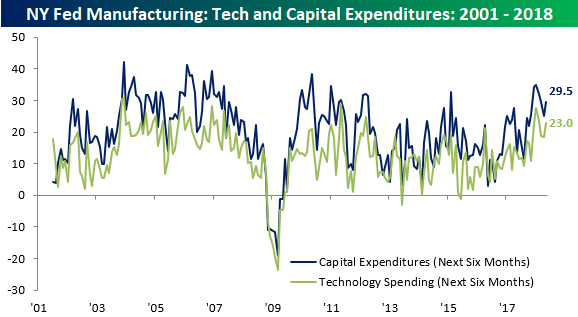
Plans for Technology Spending and Cap Ex also both saw sharp declines last month, and like the expectations index above, they rebounded in May, but are still well off their prior highs.
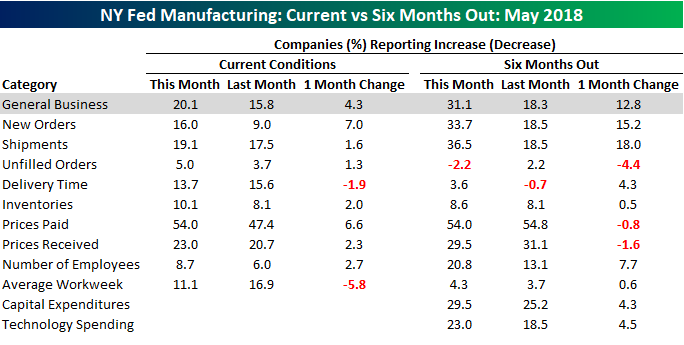
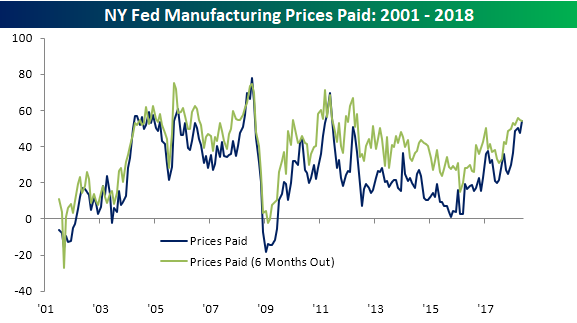
The table below breaks out each of the Empire Manufacturing report’s components on both a current and six-months out expected basis. For both current conditions and expectations, May’s readings were mostly better than April. One interesting trend worth noting is Prices Paid. The readings for that component’s current conditions and expectations for six months from now are currently at 54.0. As the chart below illustrates, though, it is very uncommon for both of these components to have similar levels.
Homebuilder Sentiment Bounces Back
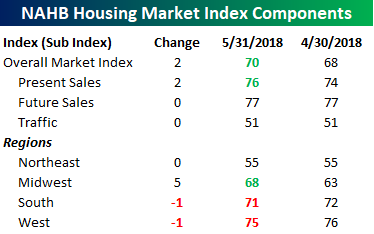
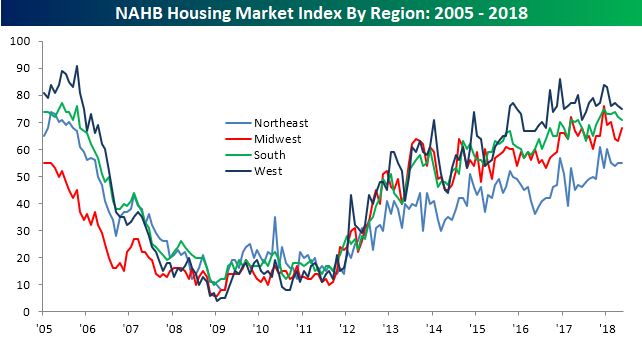
After four straight months of m/m declines, homebuilder sentiment finally saw a bounce this month, rising from a six-month low of 68 last month to 70 in May. While homebuilder sentiment is still pretty well off its highs from December, the trend of higher highs and higher lows remains intact.

The table below breaks down this month’s report by present and future sales, traffic, and region. All of this month’s improvement in the headline reading came from a jump in Present Sales, while Future Sales and Traffic were both unchanged. On a regional basis, sentiment in the Midwest saw a big jump, was unchanged in the Northeast and saw slight declines in both the South and West.