Fixed Income Weekly – 5/23/18
Searching for ways to better understand the fixed income space or looking for actionable ideals in this asset class? Bespoke’s Fixed Income Weekly provides an update on rates and credit every Wednesday. We start off with a fresh piece of analysis driven by what’s in the headlines or driving the market in a given week. We then provide charts of how US Treasury futures and rates are trading, before moving on to a summary of recent fixed income ETF performance, short-term interest rates including money market funds, and a trade idea. We summarize changes and recent developments for a variety of yield curves (UST, bund, Eurodollar, US breakeven inflation and Bespoke’s Global Yield Curve) before finishing with a review of recent UST yield curve changes, spread changes for major credit products and international bonds, and 1 year return profiles for a cross section of the fixed income world.
This week we take a look at the dismal prospects for Turkey.

Our Fixed Income Weekly helps investors stay on top of fixed income markets and gain new perspective on the developments in interest rates. You can sign up for a Bespoke research trial below to see this week’s report and everything else Bespoke publishes free for the next two weeks!
Click here and start a 14-day free trial to Bespoke Institutional to see our newest Fixed Income Weekly now!
Bespoke’s Global Macro Dashboard — 5/23/18
Bespoke’s Global Macro Dashboard is a high-level summary of 22 major economies from around the world. For each country, we provide charts of local equity market prices, relative performance versus global equities, price to earnings ratios, dividend yields, economic growth, unemployment, retail sales and industrial production growth, inflation, money supply, spot FX performance versus the dollar, policy rate, and ten year local government bond yield interest rates. The report is intended as a tool for both reference and idea generation. It’s clients’ first stop for basic background info on how a given economy is performing, and what issues are driving the narrative for that economy. The dashboard helps you get up to speed on and keep track of the basics for the most important economies around the world, informing starting points for further research and risk management. It’s published weekly every Wednesday at the Bespoke Institutional membership level.
You can access our Global Macro Dashboard by starting a 14-day free trial to Bespoke Institutional now!

The Closer — 3 of 5 Feds, EM Spreads Holding In — 5/22/18
Log-in here if you’re a member with access to the Closer.
Looking for deeper insight on markets? In tonight’s Closer sent to Bespoke Institutional clients, we review Fed manufacturing activity data given 3 of 5 regional indices are now released. We also discuss the resilience of USD EM debt spreads given chaos in EMFX.

See today’s post-market Closer and everything else Bespoke publishes by starting a 14-day free trial to Bespoke Institutional today!
B.I.G. Tips – Cramming For Midterms
With the midterm Congressional elections less than six months away, polling data is sure to start making its presence felt on the market. To help navigate through all of the noise and to prepare yourself for what to expect, we have just published a report on historical trends in control of Congress and market performance during mid-term election years. If you are already a member, please log-in here to view the report. If you’re not yet a Premium subscriber and would like to see the report, please start a two-week free trial to Bespoke Premium now. Here’s a breakdown of the products you’ll receive.
Chart of the Day: Small Caps At Home Or Abroad?
Bespoke Stock Scores — 5/22/18
The Closer — Freight & Italy — 5/21/18
Log-in here if you’re a member with access to the Closer.
Looking for deeper insight on markets? In tonight’s Closer sent to Bespoke Institutional clients, we review monthly freight price data from Cass, before reviewing the backdrop for the current crash in Italian assets, especially government bonds.
See today’s post-market Closer and everything else Bespoke publishes by starting a 14-day free trial to Bespoke Institutional today!
Investors Liked What They Saw During Earnings Season
Roughly 2,100 companies reported earnings during the unofficial Q1 2018 reporting period that ran from April 9th through May 18th. We track the one-day stock price performance of every company that reports earnings. This obviously helps us monitor individual stock performance, but it also gives us an idea of how investors are reacting to earnings results at the macro level. (In order to track performance, remember that for a stock that reports earnings in the morning before the open of trading, we use its price change on that trading day. For a stock that reports earnings after the close of trading, we use its price change on the next trading day.)
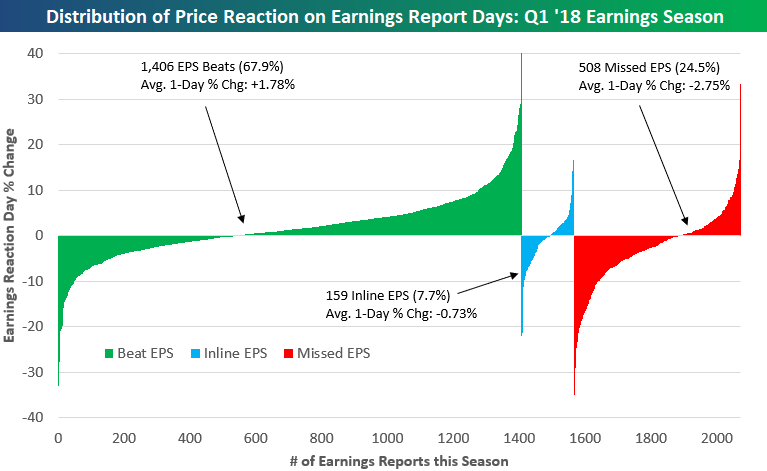
Below is a chart that shows the one-day price reaction (%) for every stock that reported earnings during the Q1 reporting period. We’ve separated the distribution by stocks that beat EPS estimates, missed EPS estimates, and reported inline EPS estimates. As shown, 67.9% of stocks beat EPS estimates, while 24.5% missed and 7.7% reported inline. The average stock that beat EPS estimates gained 1.78% on its earnings reaction day. The average stock that missed EPS estimates had a one-day drop of 2.75% in response, while the average inline report saw a one-day price drop of 0.73%.
While the average stock that beat EPS estimates gained 1.78% on its earnings reaction day, you can see in the chart that there were hundreds of stocks that beat but still fell in price. Similarly, while most stocks that missed EPS estimates fell on the news, there were plenty that gained as well.
For investors looking for detailed earnings report analysis, our Earnings Screener is an amazing tool. The Earnings Screener allows users to pull up historical quarterly earnings report analysis for every US stock going back to 2001. The Screener also allows users to track macro trends related to earnings using our “Aggregator” functionality.
The chart below uses data pulled directly from our Earnings Screener. It shows the average one-day stock price reaction to various earnings outcomes during the Q1 2018 reporting period compared to all periods since 2001. As shown, the average stock that beat EPS estimates this season gained 1.78% on its earnings reaction day. Since 2001, the average stock that has beaten EPS estimates has gained 1.90% on its earnings reaction day. So this season, earnings beats gained slightly less than normal.
For stocks that missed EPS estimates, this season they fell an average of 2.75% on their earnings reaction days. Since 2001, stocks that have missed EPS estimates have averaged a one-day decline of 3.48%. So this season, stocks that missed EPS estimates fell much less than they usually do. Stocks that reported inline EPS fell a lot less than they normally do as well. Combining the beat, miss, and inline outcomes, the average one-day change for all stocks that reported this season was +0.48%. Since 2001, the average one-day change for all stocks that have reported earnings has been +0.08%. That means that this season, stocks reacted much more positively than usual, and the reason was because the inline and missed reports fell less than they usually do.
To gain access to our Earnings Screener tool, please sign up for a Bespoke Institutional trial. The Screener is only available at the Bespoke Institutional level.
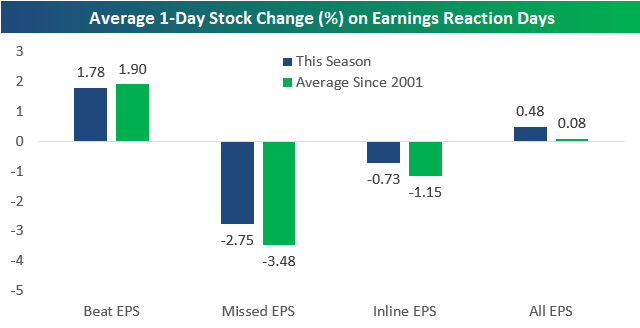
Chart of the Day: Gas Prices up Less Than Average
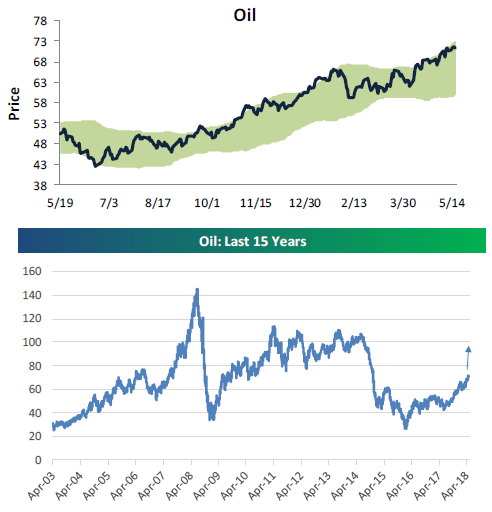
Next Stop — $80 Oil?
Below are two charts for oil — a one-year chart and a fifteen-year chart. As you can see in the one-year chart, the price of oil has been in a steady uptrend for the last eleven months.
The longer term chart for oil looks much different than the one-year chart. Ten years ago, oil was trading above $140, so it’s about half that price right now. Should price continue higher in the near-term, it’s next resistance level is $80, which is the bottom of the $80-$100 range that it traded in from 2010 through 2014.