Stocks Start Summer Steady
Memorial Day has been the unofficial first bookend to summer for decades. Prior to 1971, the date floated around a bit as it was traditionally the last day of May. Since 1971, it’s been formally changed to the last Monday in May. Originally, it was known as “Decoration Day,” as a formal date to decorate graves of the fallen in the years after the Civil War, but over the years the name shifted to Memorial Day.
For stock market investors, the shortened Memorial Day week has historically been positive.
As shown in the chart below, average and median returns are higher for Memorial Day week than all weeks since 1971, and stocks are more likely than average to end the week up. Since 1971, the S&P 500’s average return during the four-day week of Memorial Day has been an advance of 0.54% (median: 0.61%) with positive returns 62% of the time. That’s quite a bit higher than the average return of 0.16% (median: 0.27%) for all weeks since 1971.
Higher High in Bullish Sentiment
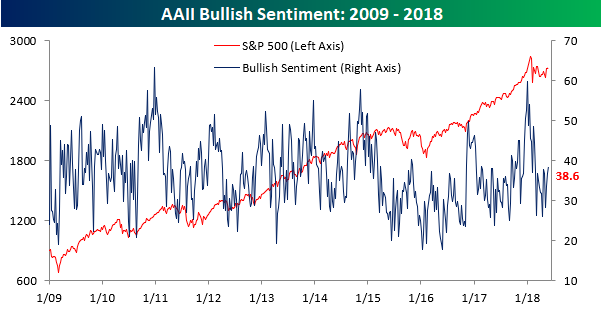
Despite a back and forth market over the last few days, individual investors have managed to show slightly more bullishness than last week. According to the weekly survey from AAII, bullish sentiment increased this week from 36.68% up to 38.56%. That’s the third straight weekly increase, and also marks a higher high in bullish sentiment versus the mid-April high. So just as technicians were celebrating the higher high in the S&P 500 two weeks ago, this week’s “sentiment-icians” can celebrate a higher high in bullish sentiment.
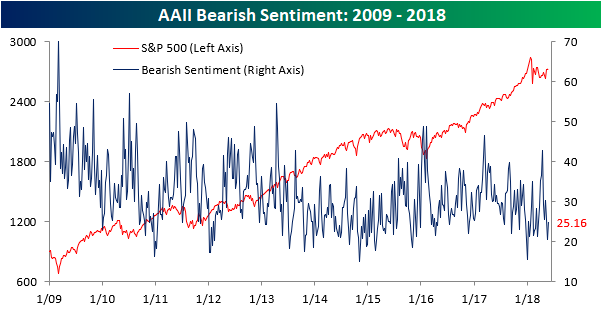
Interestingly, right along with the increase in bullish sentiment, bearish sentiment also ticked higher from last week’s extremely low levels. In this week’s survey, investors considering themselves bearish rose from a 19-week low of 20.58% up to 25.16%.
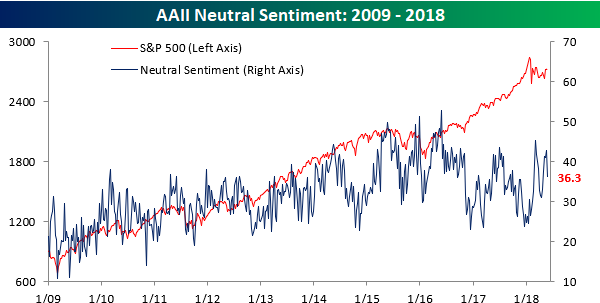
Rather than being more bearish or bullish this week, investors were just a little more decisive, and that’s reflected in the fact that neutral sentiment fell from a high reading of 42.74% down to 36.27%.
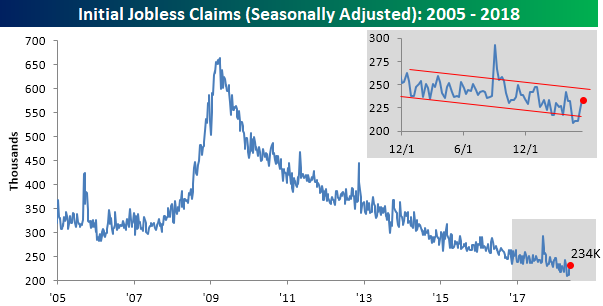
Jobless Claims Edge Higher
When it comes to the weekly update on Jobless Claims, recently it seems like each week there’s another record low broken. That didn’t happen this week, though, as the headline print came in at 234K, which was up 11K from last week’s print of 223K and above consensus expectations for a level of 220K. Even with the higher than expected reading, though, claims came in below 300K for the 168th straight week, and they were below 250K for the 33rd straight week. That’s the longest streak of sub-250K readings since 1970.
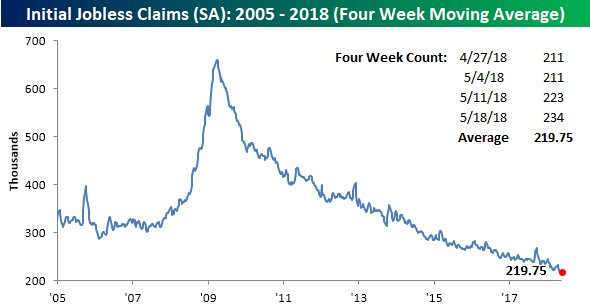
With the relatively large weekly increase in claims, the four-week moving average also ticked higher, breaking a streak of four straight weeks of declines. At the current level of 219.75K, the four-week moving average is just over 6K above its multi-decade low of 313.5K set last week.
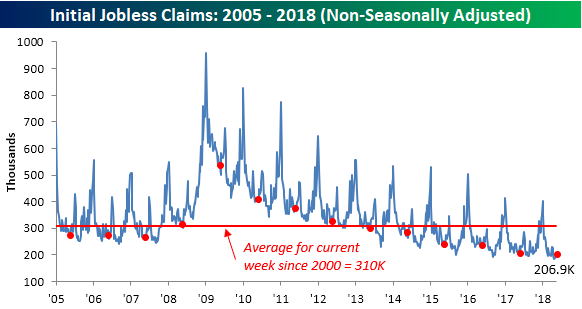
On a non-seasonally adjusted (NSA) basis, claims edged above 200K for the first time since mid to late April. Even with the increase, though, they are still more than 105K below their average for the current week of the year dating back to 2000. In fact, you have to go all the way back to 1973 to find a time when NSA claims were this low at this time of year.
B.I.G. Tips – Decile Analysis Since 4/2/18
the Bespoke 50 — 5/24/18
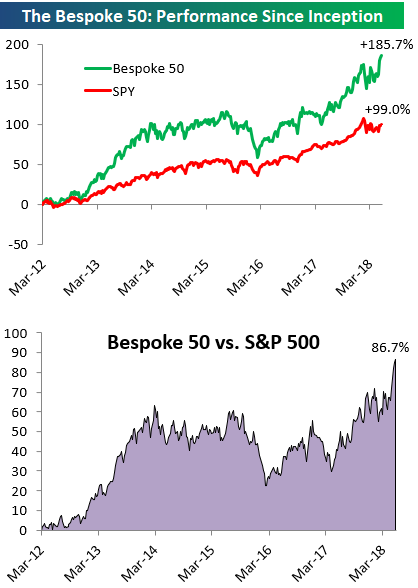
Every Thursday, Bespoke publishes its “Bespoke 50” list of top growth stocks in the Russell 3,000. Our “Bespoke 50” portfolio is made up of the 50 stocks that fit a proprietary growth screen that we created a number of years ago. Since inception in early 2012, the “Bespoke 50” has beaten the S&P 500 by 86.7 percentage points. Through today, the “Bespoke 50” is up 185.7% since inception versus the S&P 500’s gain of 99.0%. Always remember, though, that past performance is no guarantee of future returns.
To view our “Bespoke 50” list of top growth stocks, click the button below and start a trial to either Bespoke Premium or Bespoke Institutional.
The Closer — Yields Reverse, Doves Not So Clear, EIA, New Home Revisions — 5/23/18
Log-in here if you’re a member with access to the Closer.
Looking for deeper insight on markets? In tonight’s Closer sent to Bespoke Institutional clients, we recap recent price action in vol, rates, and metals markets. We also discuss today’s Fed Minutes, new home sales, EIA petroleum market data, and recent energy price action.

See today’s post-market Closer and everything else Bespoke publishes by starting a 14-day free trial to Bespoke Institutional today!
Keeping Track of EM
There’s been a lot going on in emerging markets recently. Whether it’s political drama in South Africa, Malaysian elections, Argentina’s emergency rate hikes and request for IMF assistance, or the ongoing meltdown of the Turkish lira, it’s all a lot to stay on top of. Especially for investors that don’t spend their days in the weeds of EM, how to follow it all? Bespoke has a range of tools that can help.
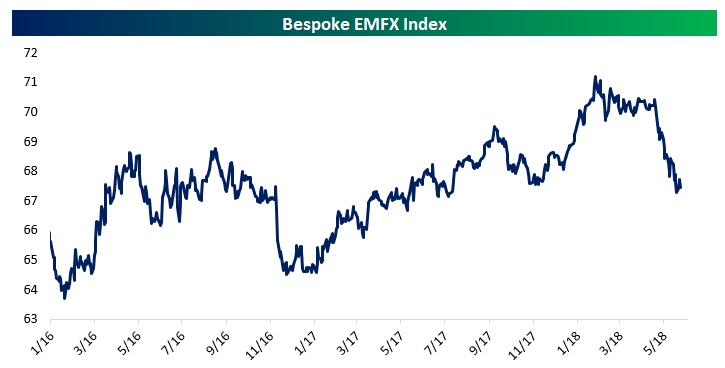
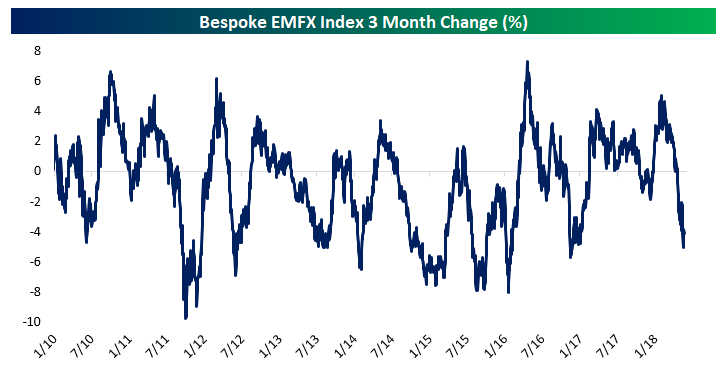
First, one of the easiest ways to keep track of how things are going is to watch the value of EM currencies (EMFX) versus the dollar. We like to use an index of 20 equally-weighted EM currencies to get a broad feel for how things are going. The absolute level of the index is somewhat arbitrary, but since it captures the performance of a broad range of the asset classes, its trend gives a good feel for how things are going. As shown below, it’s been a pretty rough run of late. We also show the 3 month change in the index, which is useful for comparing how painful periods of stress are; the current selloff is akin to the dollar rally post-election, but not as bad and not as sustained as things were in 2015-2016. Of course, this measures spot only, so it’s only a rough gauge rather than a performance benchmark.
It’s also helpful to look at other asset classes. Using our Chart Tool, it’s easy to keep an eye on charts for relevant assets. The EMB ETF tracks USD-denominated bonds issued by EM governments, so it’s an interesting place to look.
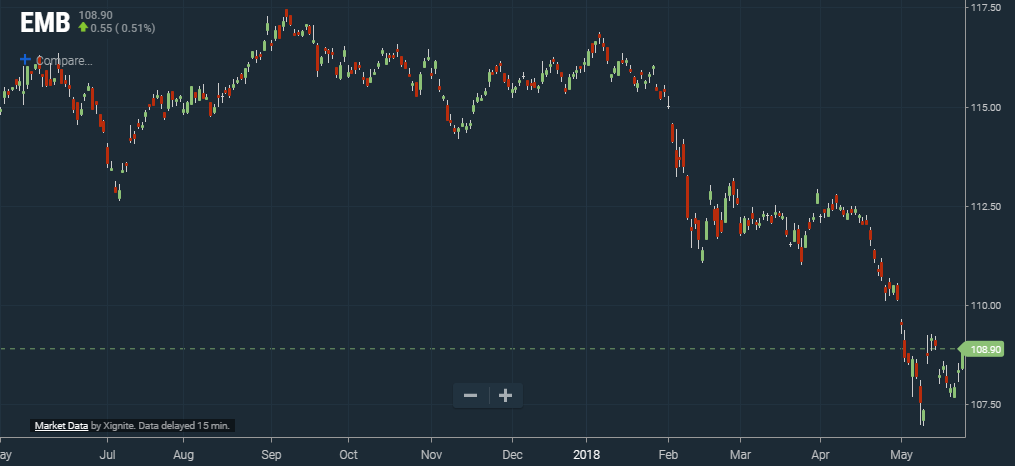
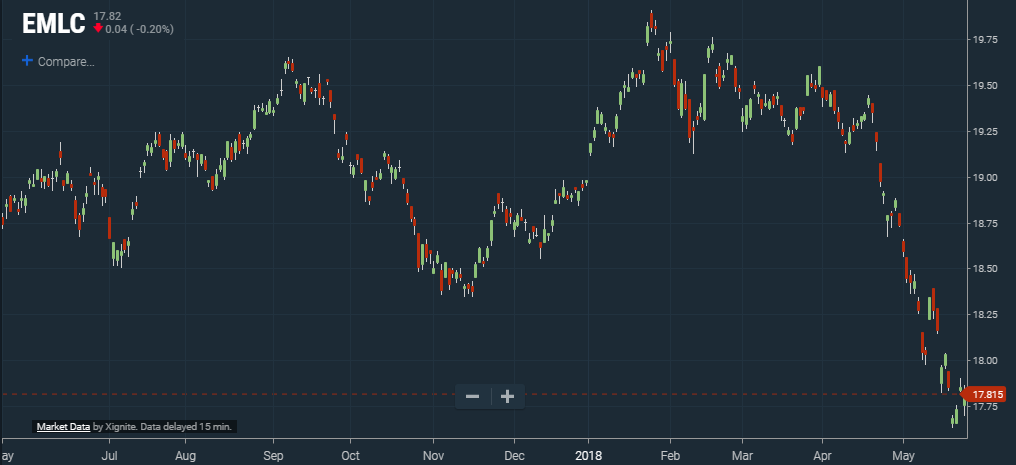
Remember, though, that while these USD bonds trade at a spread to US Treasuries, they’re still very sensitive to moves in US interest rates that may have nothing to do with EM performance. So we also keep a close eye on local-currency EM debt via the EMLC ETF. Prices of this ETF are a function of both EMFX and EM local currency interest rates.
What about equities? EEM is the classic, highly liquid and representative of the broad EM space. Be careful, though: Chinese companies listed in Hong Kong are a huge weight, which can sometimes skew the message it sends.

In a recent Chart of the Day, we highlighted the extremely large share of EEM taken up by a single company, Tencent:

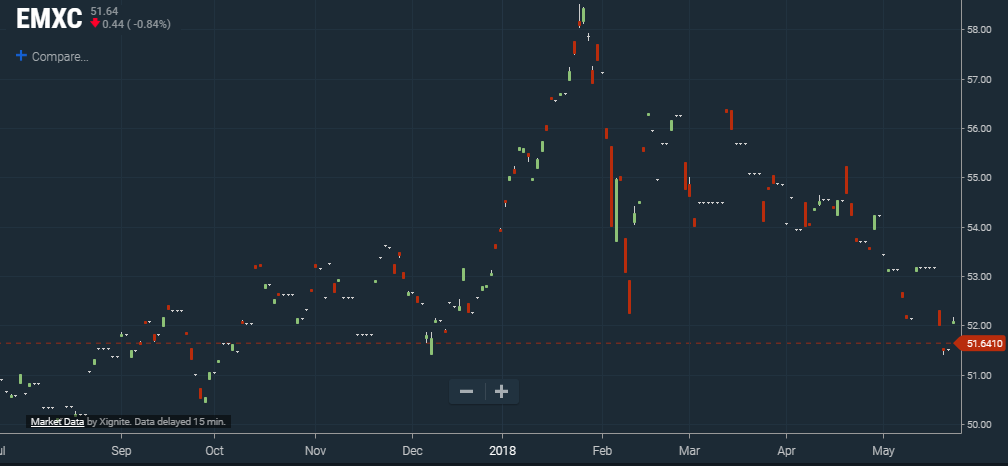
It’s always worth checking in on EMXC too, the EM ex-China ETF. A recent launch and not very liquid, this ETF nonetheless is probably more representative of thematic EM equity performance than EEM because it isn’t so heavily weighted to the rather unique Chinese equity markets.
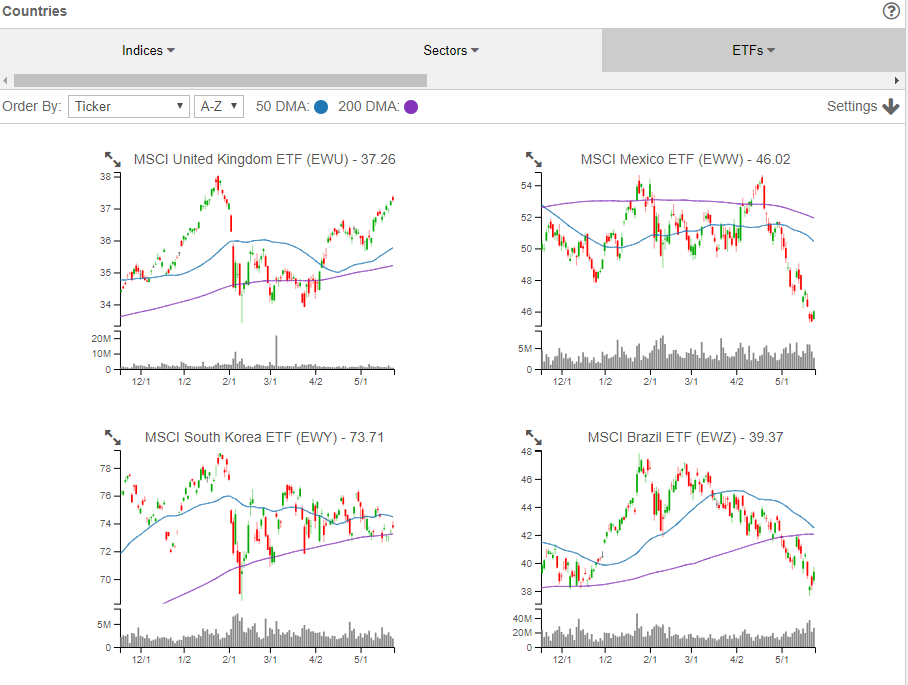
If charts are your thing, you’ll also love our Chart Scanner tool, which allows you to quickly scan a large number of charts. One pre-loaded portfolio focuses on country ETFs, including a number of country-specific equity ETFs for EM (note: while included in the example below, the UK is not considered an EM).
Another helpful tool we’ve developed for looking at ETF data in bulk is our Trend Analyzer. This tool allows you to quickly size up the trend and tactical movement for a wide range of ETFs or stocks, including custom portfolios. Below we show a custom Trend Analyzer portfolio focused on EM ETFs.

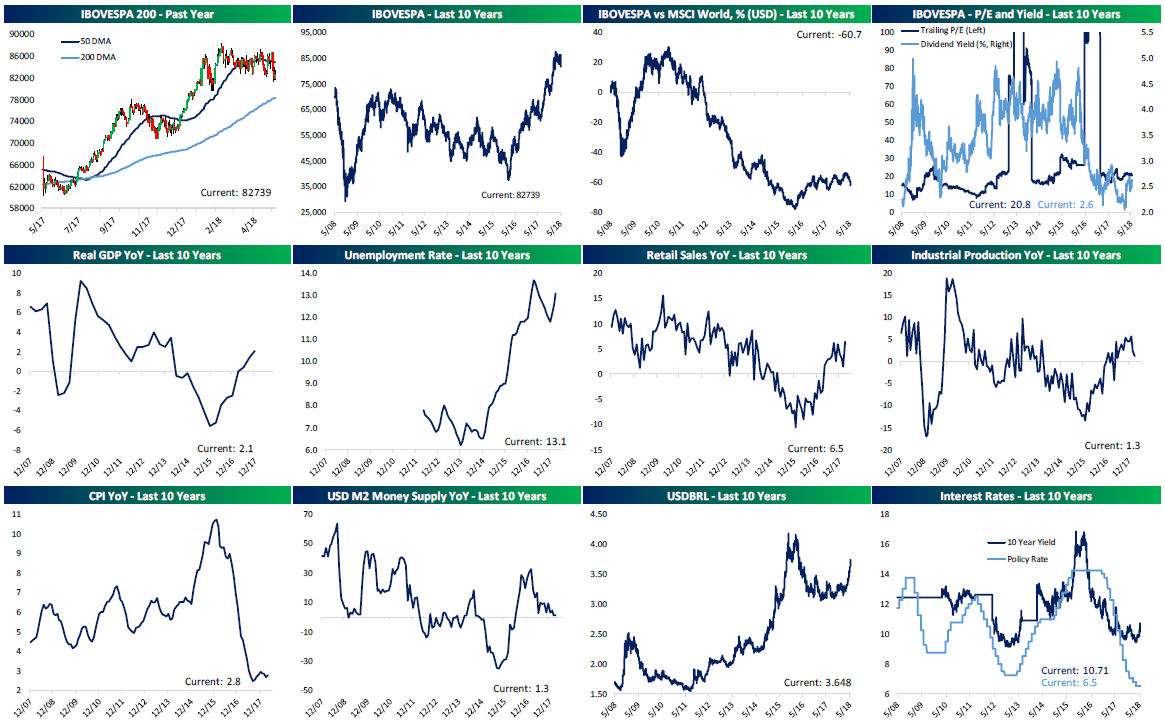
Each week, Bespoke Institutional subscribers receive a chartpack highlighting financial market and economic data in a standardized format across 23 major global economies including a number of emerging markets. Below, for example, we show the data for Brazil in this week’s Global Macro Dashboard, sent out this morning.
Looking for more in-depth analysis that goes beyond price action? We regularly recap economic data, cross asset performance, and analyze various EM economies and related assets in The Morning Lineup, The Closer, and our Fixed Income Weekly. Below is an example, with charts we included with this week’s Fixed Income Weekly dealing specifically with the mess ongoing in Turkey.
To gain access to all of the tools described above, please sign up for a Bespoke Institutional trial. Some reports and tools are available at other levels, but Institutional clients receive access to ALL of our research and tools.
Mirror Days
Earlier this morning we tweeted out the following images from our Morning Lineup report (available to all Bespoke Premium or Bespoke Institutional clients) pointing out how the overnight and pre-market pattern from Tuesday into Wednesday was nearly a mirror image of the overnight to pre-market pattern of the prior day. Heading into the day Tuesday, equities began to rally shortly into the Asian trading day and picked up steam right up until the US open. Last night, our global composite intraday equity chart was right around flat at the open in Asia but then quickly started to lose ground and drifted lower right up until the US open.
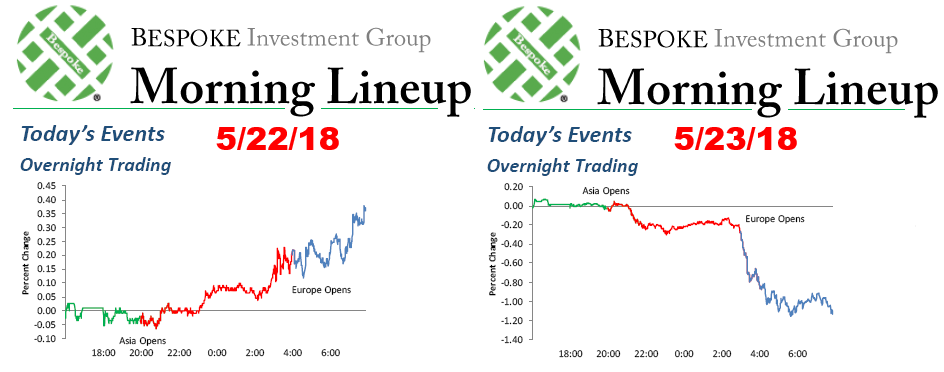
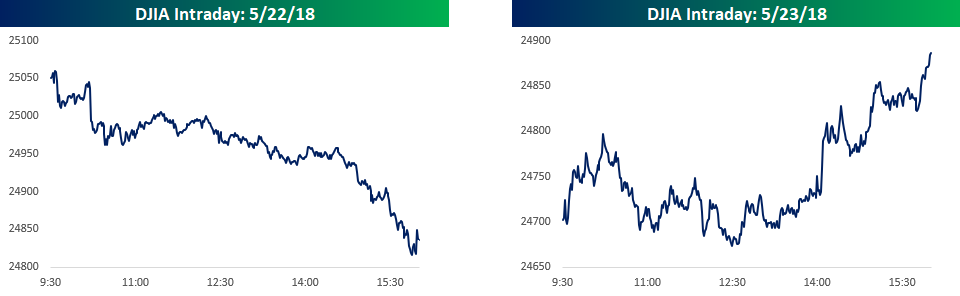
Interestingly enough, just as the overnight patterns heading into each of the last two trading days were mirror images of each other, so were the intraday open to close chart patterns. On Tuesday (5/22), the DJIA opened at its highs of the day and drifted lower throughout the day before really selling off into the close. Then today (5/23), the S&P 500 opened right near its lows of the day only to pick up steam late in the session and closing right near the highs of the day!
This all reinforces the point that unless there is a major catalyst/event behind a move, what happens in the futures markets often has little bearing on what actually happens during the regular trading day.
Top Earnings Season Triple Plays — 5/23/18
Here at Bespoke, our job is to identify winners and losers, and one of the ways we try to find earnings-season winners is through our list of “triple plays.”
Long-term Bespoke subscribers know how much we like triple plays, but for those that haven’t heard of the term, we came up with it back in the mid-2000s for companies that beat analyst earnings estimates, beat analyst revenue estimates and also raise guidance. Investopedia.com is one of the best online resources for financial markets education, and they’ve actually given us credit for coining the “triple play” term on their website. We consider triple play stocks to be the cream of the crop of earnings season, and we are constantly finding new long-term buy opportunities from this basket of names each quarter.
This earnings season (Q1 2018), there were a total of 133 earnings triple plays. That’s a high reading indicative of a healthy corporate environment. Throughout earnings season, Bespoke Premium and Institutional members have access to our Earnings Triple Plays page, which keeps a running tally of the 100 most recent triple plays. We also publish our Top Triple Plays Report, which filters the list of most recent triple plays down to the ones with the most attractive chart patterns. We’ve just published our newest Top Triple Plays Report featuring 28 stocks with chart patterns that we like. Learn how to see the stocks below!
See our Top Earnings Season Triple Plays by signing up for a Bespoke Premium membership now. Click this link for a 14-day free trial!