Bespoke Stock Scores — 5/29/18
Consumer Confidence Remains Near Multi-Year Highs
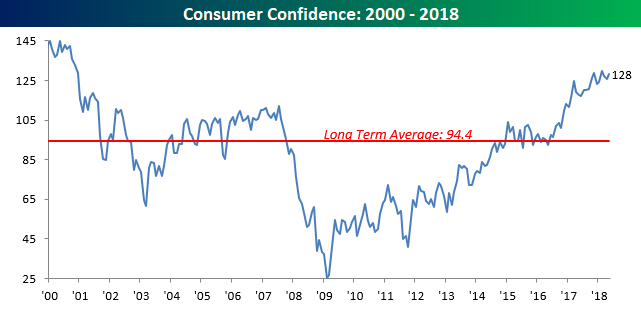
Consumer confidence for the month of May came in right in line with expectations, rising to 128.0 from a downwardly revised reading of 125.6 in April. As shown in the chart, consumers are just about as confident as they have been at any time since 2001.
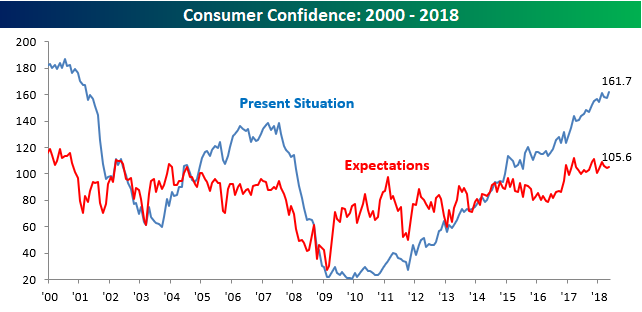
Breaking out sentiment by the Present Situation and Expectations shows a somewhat mixed picture. On the one hand, the current situation for consumers is very positive as that index rose to its highest level since March 2001. Expectations, on the other hand, have been drifting lower for well over a year now since peaking in March 2017.
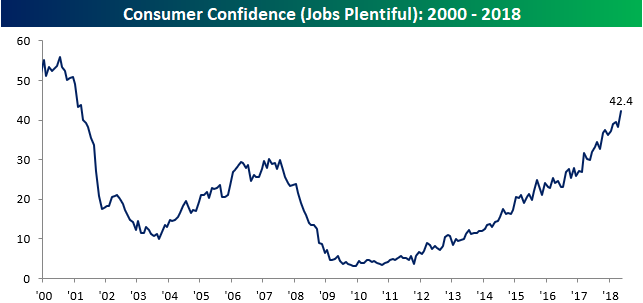
One reason consumers feel so upbeat about current conditions is related to jobs. In this month’s survey, the index of “Jobs Are Plentiful” rose to 42.4. That’s the largest one-month increase in this index since last October and puts the index at its highest level since March 2001.
Finally, sentiment towards the stock market also rebounded in May. After April’s reading where positive sentiment towards the stock market dropped to its lowest level since the 2016 election, we saw a rebound in May as 38.3% of consumers now expect higher stock prices compared to just 24.4% who expect prices to decline. After today’s tape, though, that boost in sentiment may not be all that long-lasting.

Bespoke Brunch Reads: 5/27/18
Welcome to Bespoke Brunch Reads — a linkfest of the favorite things we read over the past week. The links are mostly market related, but there are some other interesting subjects covered as well. We hope you enjoy the food for thought as a supplement to the research we provide you during the week.
Italy
Will Italian banks spark another financial crisis? by Jeffrey Moore (Global Risk Insights)
While our position would be a decisive “no”, the dire picture of Italy’s financial system painted in this 2016 overview is worth keeping in mind. One especially interesting tidbit is the differing geography of NPL concentration between north and south. [Link]
Second thoughts on miniBOTs by Toby Nangle (Principles and Interest)
Why the so-called “mini-BOT” instruments proposed by the platform of Italy’s new populist government are an ineffective tool, even leaving aside their negative impact on Italy’s other forms of sovereign debt and market access. [Link]
Crypto
A crypto stunt gone tragically wrong by Jemima Kelly and Alexandra Scaggs (FTAV)
A publicity stunt by Ukraine-based ASKfm to plant a hard drive full of tokens at the summit of Mount Everest resulted in the emergency evacuation of the team and the death of a Sherpa assisting them. [Link; registration required]
U.S. Launches Criminal Probe into Bitcoin Price Manipulation by Matt Robinson and Tom Schoenberg (Bloomberg)
With bitcoin now a reference for multiple futures contracts, US regulators are starting an investigation of price manipulation in spot markets, including spoofing. [Link; auto-playing video, soft paywall]
Trump Tweets
Judge Rules Trump Can’t Block People on Twitter by Chris Dolmetsch and Patricia Hurtado (Bloomberg)
Because the President is a public official, his account is considered a “public forum” and therefore cannot simply block users according to a federal court ruling this week. [Link; auto-playing video, soft paywall]
Inside the Trump Tweet Machine: Staff-written posts, bad grammar (on purpose), and delight in the chaos by Annie Linskey (Boston Globe)
The grammatically destitute state of the President’s Twitter feed is often the result of specific choices by a team of staffers who send out tweets in his voice. [Link]
Tech
Blocking 500 Million Users Easier Than Complying With GDPR by Nate Lanxon (Bloomberg)
Compliance with the sweeping new privacy regulation in Europe is a thorny thicket, so much so that a big chunk of the American media landscape simply cuts off access to their sites from the entire EU as a temporary measure to remain compliant. [Link]
Amazon Pushes Facial Recognition to Police. Critics See Surveillance Risk. by Nick Wingfield (NYT)
Since 2016 Amazon has been hawking a service that helps identify people based on their facial features, with law enforcement agencies a major customer. Now, the ACLU and other civil rights organizations are concerned about the implications, especially for non-criminals that law enforcement may decide to track anyways. [Link; soft paywall]
Research
Era of ‘lower for longer’ oil prices is dead by Amrita Sen and Yasser Elguindi (FT)
With oil markets tightening up despite a best-effort showing by the shale patch to ramp up supply as fast as possible, Energy Aspects analysts argue that oil prices are sustainable at current levels and headed higher. [Link; paywall]
The links between stagnating wages and buyer power in U.S. supply chains by Nathan Wilmers (Washington Center for Equitable Growth)
One possible explanation for wage growth is growing monopsony (single-buyer) power for large firms, which pressures wages lower among suppliers. [Link]
Long Reads
Burying NYC’s Forgotten Dead at Hart Island by Bess Lovejoy (JSTOR)
Since 1869, New York City’s municipal cemetery has been on Hart Island, a little stretch of terra firma a few miles west of Pelham Bay Park in Long Island Sound. Over the years, more than a million souls have found their final resting place on the island. [Link]
Death of a Biohacker by Jonah Engel Bromwich (NYT)
A secretive and frankly sketchy leader in the community of entrepreneurs and experimenters who look to modify the human body in myriad ways mysteriously died in a sensory deprivation tank. [Link]
Big Trades
Bond Trader Reaps 2,000% Profit by Just Trusting the Fed by Edward Bolingbroke (Bloomberg)
A bet that the Fed would simply do what it was forecasting it would do (combined with the leverage of options on already extremely leveraged Eurodollar futures) delivered some pretty fantastic returns for on bond market player. [Link; auto-playing video, soft paywall]
Dan Loeb wants to raise $400M to target fintech by Carleton English (NYP)
The latest in a string of capital raises targeted at financial technology is Third Point, which has set up an acquisition company to begin investing in the space at scale. [Link]
Food
With Recipes, the Key to Making Millions Is Not About the Food by Kate Krader (Bloomberg)
Recipes are not open for copyright, and that creates some unique incentives for the intellectual property of creating new culinary concoctions. [Link; soft paywall]
Read Bespoke’s most actionable market research by starting a two-week free trial today! Get started here.
Have a great Sunday!
The Bespoke Report — On Again, Off Again
The Closer: End of Week Charts — 5/25/18
Looking for deeper insight on global markets and economics? In tonight’s Closer sent to Bespoke clients, we recap weekly price action in major asset classes, update economic surprise index data for major economies, chart the weekly Commitment of Traders report from the CFTC, and provide our normal nightly update on ETF performance, volume and price movers, and the Bespoke Market Timing Model. We also take a look at the trend in various developed market FX markets.
Below is a snapshot from today’s Closer highlighting weekly intraday price charts for major equity indices and other asset classes. If you’d like to see more, start a free trial below.

The Closer is one of our most popular reports, and you can sign up for a free trial below to see it!
See tonight’s Closer by starting a two-week free trial to Bespoke Institutional now!
Best and Worst Performing Nasdaq 100 Stocks of 2018
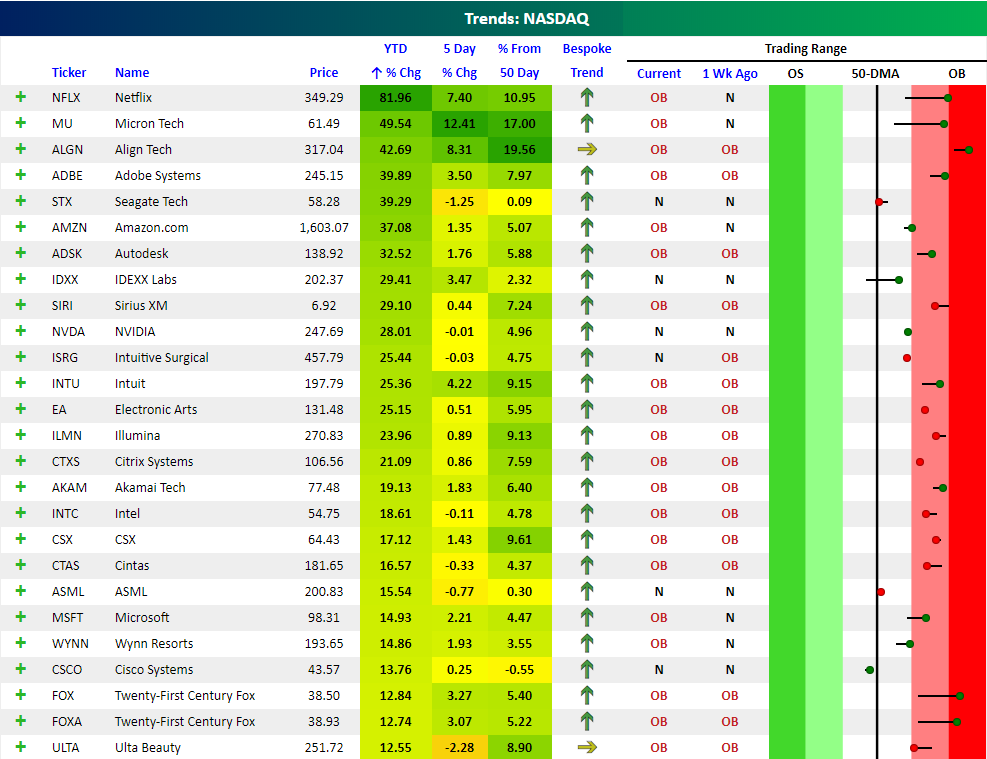
The average stock in the Nasdaq 100 is up just over 3% year-to-date. Using snapshots from our popular Trend Analyzer tool, below is a look at the best and worst performing stocks in the Nasdaq 100 so far in 2018.
At the top of the list is Netflix (NFLX) with a year-to-date gain of 81.96%. Over the last five days alone, NFLX is up 7.4%, and it’s 10.95% above its 50-day moving average. As you can see in the trading range screen on the right side of the snapshot, recent gains have pushed NFLX well up into overbought territory.
Micron (MU) has experienced an even bigger move over the last five trading days with a gain of 12.41%. The stock is 17% above its 50-DMA, and it’s up 49.5% YTD.
Align Tech (ALGN) is the third strongest Nasdaq 100 stock so far in 2018 with a gain of 42.69%. Behind ALGN are Adobe (ADBE), Seagate (STX), Amazon.com (AMZN), and Autodesk (ADSK) — all with 2018 gains of more than 30%.
Other notables on the list of big winners so far this year for the Nasdaq 100 include NVIDIA (NVDA) with a gain of 28%, Intel (INTC) at +18.6%, Microsoft (MSFT) at +14.93%, and Wynn Resorts (WYNN) at +14.86%.
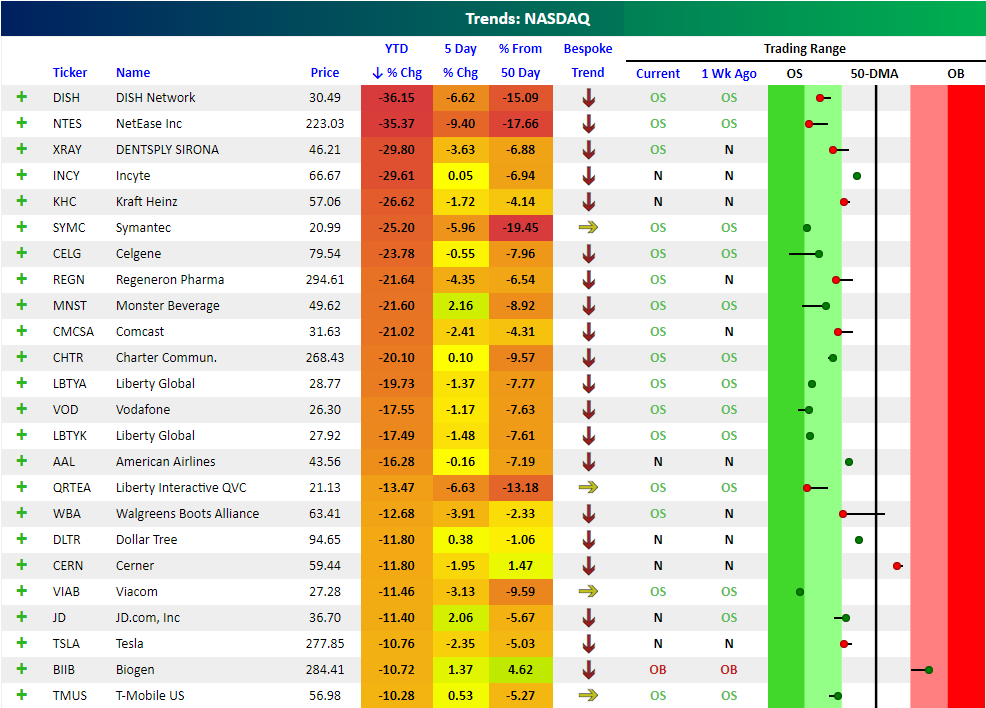
Not all Nasdaq 100 stocks are going gang-busters this year. As shown below, 11 stocks in the index are down more than 20%, and an additional 13 are down 10%+.
DISH Network (DISH) and NetEase (NTES) lead the list of losers with year-to-date declines of more than 35%. DENTSPLY SIRONA (XRAY), Incyte (INCY), Kraft Heinz (KHC), and Symantec (SYMC) are all down more than 25%, while stocks like Celgene (CELG) and Comcast (CMCSA) — among others — are down more than 20%. As you can see from our “Trend” ratings and our Trading Range section, the majority of these stocks are in long-term downtrends and trading in oversold territory. Visit our Trend Analyzer page to learn more about this unique feature that’s part of our Bespoke Premium service.
The Closer — Bulls Flat, 4 Feds In, Where’s The Cheapest Market? — 5/24/18
Log-in here if you’re a member with access to the Closer.
Looking for deeper insight on markets? In tonight’s Closer sent to Bespoke Institutional clients, we review recent bull flattening in the US yield curve, the release of Kansas City Fed manufacturing activity data, and which equity markets are the most cheaply valued around the world.

See today’s post-market Closer and everything else Bespoke publishes by starting a 14-day free trial to Bespoke Institutional today!
Capex Plans Work Off Some Heat
Recent surveys from the various manufacturing surveys run by private data providers and regional Federal Reserve banks have been pretty strong. For instance, the Markit flash Manufacturing PMI for the United States released earlier this week hit its highest levels in almost 4 years. Today, the KC Fed Manufacturing composite (which covers factories in the western half of Missouri, Oklahoma, Kansas, Nebraska, Wyoming, Colorado, and northern New Mexico) beat expectations handily, recording a reading of 29 versus 20 expected by economists and 26 in April.
One area of weakness, though, has been capex plans. In the chart below we show the diffusion index for planned capex across the four regional Fed indices (Kansas City, New York, Philadelphia, and Richmond) that have been released so far for May. The average of these 4 peaked at a record level in February, with a net 36.1% of companies on average across the 4 reporting increased capex spending plans over the next six months. Since then, however, it’s been a one-way trip lower. The May reading of 27.0 is still very, very strong by historical standards but it’s falling quickly. Probably not the end of the world, but the very robust expectations from Q1 weren’t sustainable and are now mean-reverting.
Bespoke’s Sector Snapshot — 5/24/18
We’ve just released our weekly Sector Snapshot report (see a sample here) for Bespoke Premium and Bespoke Institutional members. Please log-in here to view the report if you’re already a member. If you’re not yet a subscriber and would like to see the report, please start a two-week free trial to Bespoke Premium now.
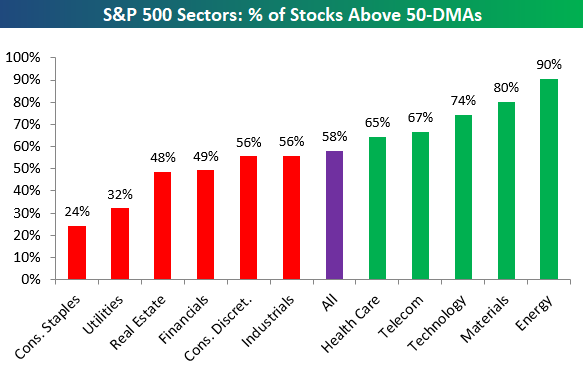
Below is one of the many charts included in this week’s Sector Snapshot, which highlights the percentage of stocks by sector trading above their 50-day moving averages. As shown, 58% of S&P 500 stocks remain above their 50-DMAs, and seven of eleven sectors have healthy readings above 50%.
To find out what this means and to see our full Sector Snapshot with additional commentary plus six pages of charts that include analysis of valuations, breadth, technicals, and relative strength, start a two-week free trial to our Bespoke Premium package now. Here’s a breakdown of the products you’ll receive.