Bespoke Sector Trading Range Charts
The S&P 500 has held onto morning gains so far this afternoon, which is a positive sign. Below is a look at our trading range charts for S&P 500 sectors (Real Estate excluded). The red shading in each chart represents overbought territory, while the green shading represents oversold territory. We’ve drawn trend lines where applicable.
The Consumer Discretionary sector has solidly broken its short-term downtrend channel and is now making a run for a test of prior all-time highs. It’s the complete opposite story for Consumer Staples, which remains in a nasty downtrend.
The Energy sector appears to have made a double top recently, so it will be interesting to see how it trades over the next few weeks. The Financial sector has been a big disappointment relative to other cyclical sectors over the last month or two. As other areas of the market have rallied, the Financials remain stuck in a downtrend. The Industrials sector had a pattern very similar to Financials up until the last few weeks, but it has managed to break above its downtrend channel and is so far holding above support at its 50-DMA. Both Health Care and Materials look similar to Industrials.
Of the ten sectors shown, it’s Technology that looks the strongest. Today the sector broke out to another all-time high, which marks the resumption of its long-term uptrend channel.
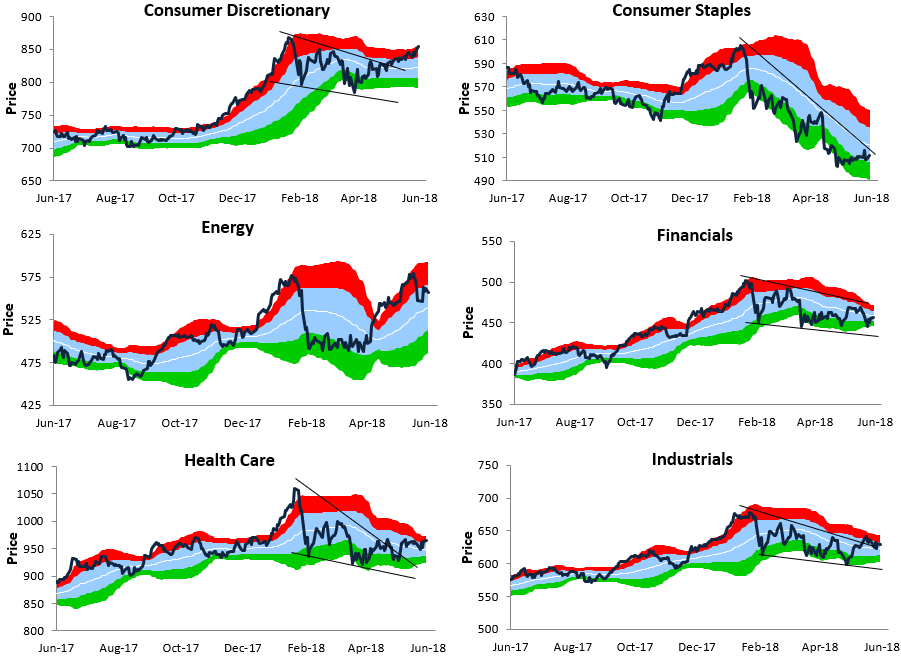
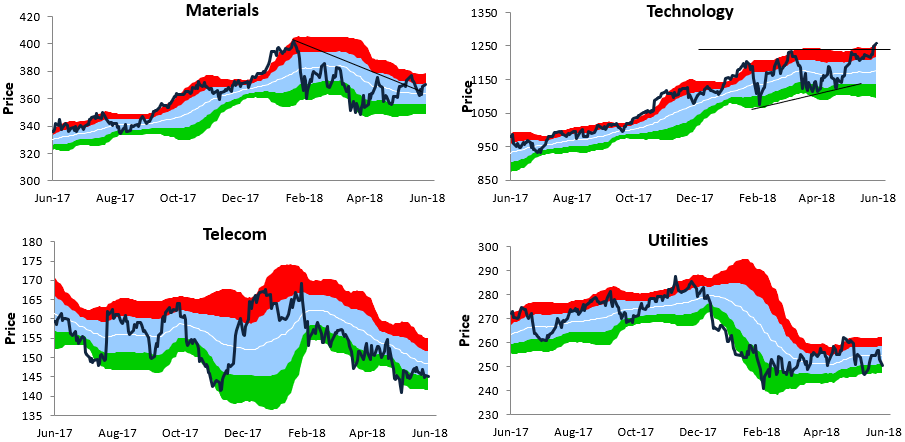
Chart of the Day: S&P 500 Levels, Tech’s Weight
Bespoke Brunch Reads: 6/1/18
Welcome to Bespoke Brunch Reads — a linkfest of the favorite things we read over the past week. The links are mostly market related, but there are some other interesting subjects covered as well. We hope you enjoy the food for thought as a supplement to the research we provide you during the week.
Social Media
The Curious Case of Bryan Colangelo and the Secret Twitter Account by Ben Detrick (The Ringer)
The President of the Philadelphia 76ers operated a series of pseudonymous Twitter accounts that criticized players, debated coaching staff decisions, leaked information about a forthcoming trade, and disclosed medical information. A very, very strange tale to say the least. [Link]
What It’s Like When Elon Musk’s Twitter Mob Comes After You by Erin Biba (The Daily Beast)
While being supportive of Tesla and its controversial CEO is one thing, Twitter users often carry things to an absurd degree when journalists speak any ill of Elon Musk. [Link]
Facebook sinking fast among US teens: survey (Phys.org/AFP)
New research from Pew shows that only slightly more than half of 13-17 year olds compared with over 70% back in 2014-2015. 85% use YouTube, 72% use Instagram, and 69% use Snapchat. [Link]
Jack Dorsey had a $700 million month by Ari Levy (CNBC)
While investors are still somewhat dubious about his ability to serve as CEO of two different companies at the same time, it has been a very good month for Jack Dorsey, CEO of surging Twitter and Square. [Link]
Labor Markets
Vermont will pay you $10,000 to move there and work remotely by Corinne Purtill (Quartz)
While Vermont has gorgeous scenery and offers a potentially bucolic lifestyle, it’s got a shrinking tax base and is hoping to attract high income remote professional workers with a significant tax credit. [Link]
Walmart Says It Will Pay for Its Workers to Earn College Degrees by Michael Corkery (NYT)
This week the nation’s largest retailer announced a plan to subsidize college classes for full- and part-time workers, offering courses in supply chain management or business for $1 per day. [Link; soft paywall]
Asian Affairs
That Calm Chinese Stock Market? It’s Engineered by the State by Shen Hong and Stella Yifan Xie (WSJ)
An excellent rundown of the various measures taken by the Chinese government to suppress volatility and share price declines. [Link; paywall]
18 Hours and 45 Minutes: Longest Commercial Flight Returns to Service by Zach Wichter (NYT)
The world’s longest commercial flight is coming back, with a direct flight from Newark, NJ to Singapore. This flight will be 67 lie-flat business seats and another 94 premium economy spots. [Link; soft paywall]
High Society
Maybe She Had So Much Money She Just Lost Track of It by Jessica Pressler (The Cut)
A remarkable story about a huckster that managed to insert herself into elite circles that float between LA, NYC, London, and the Continent; her run was fueled by confidence tricks, bank fraud, and an aggressive tipping policy. [Link]
Canada
How Kinder Morgan won a billion-dollar bailout on Canada pipeline by David Ljunggren, Liz Hampton, Gary McWilliams (Reuters)
Following a massive policy debate about how to permit a pipeline between Alberta and British Columbia, the Canadian government has bailed the project out with a massive purchase. [Link]
History
Wealth, Slave Ownership, and Fighting for the Confederacy: An Empirical Study of the American Civil War by Andrew B. Hall, Connor Huff, and Shiro Kuriwaki (American Political Science Review Working Papers)
A quantitative effort designed to show causal links between slave ownership and propensity to fight on behalf of the Confederacy, suggesting that protection of the institution of slavery was the overriding concern when deciding whether to fight. [Link; 58 page PDF]
Investors
I’m Ray Dalio. Ask me anything! Answering questions from 11:30 AM – 1:00 PM EDT. (Reddit)
An online question and answer section with the man that runs the biggest (and one of the best performing) hedge funds in the world. [Link]
Read Bespoke’s most actionable market research by starting a two-week free trial today! Get started here.
Have a great Sunday!
The Closer: End of Week Charts — 6/1/18
Looking for deeper insight on global markets and economics? In tonight’s Closer sent to Bespoke clients, we recap weekly price action in major asset classes, update economic surprise index data for major economies, chart the weekly Commitment of Traders report from the CFTC, and provide our normal nightly update on ETF performance, volume and price movers, and the Bespoke Market Timing Model. We also take a look at the trend in various developed market FX markets.
Below is a snapshot from today’s Closer highlighting weekly intraday price charts for major equity indices and other asset classes. If you’d like to see more, start a free trial below.

The Closer is one of our most popular reports, and you can sign up for a free trial below to see it!
See tonight’s Closer by starting a two-week free trial to Bespoke Institutional now!
The Bespoke Report — A Memorable May
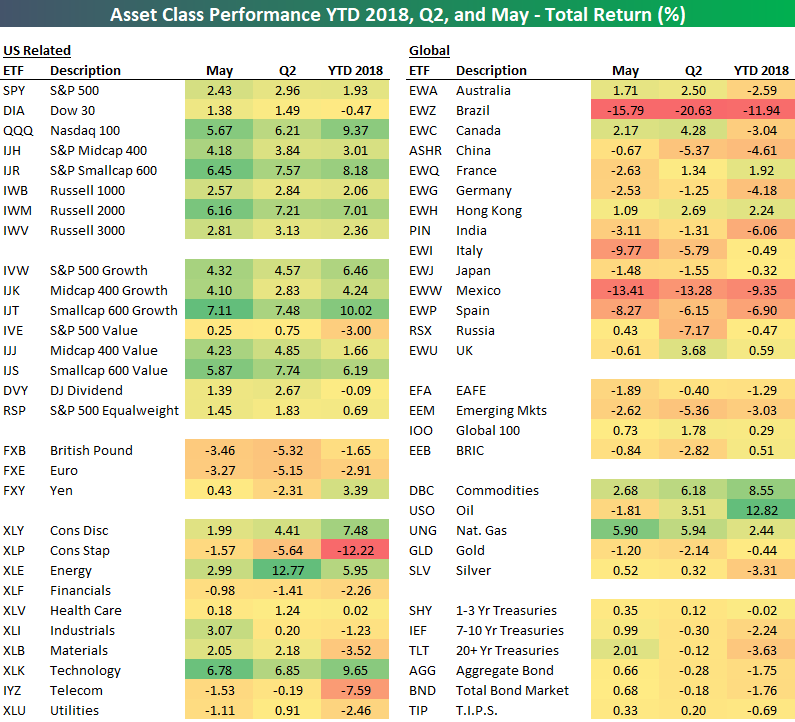
We’ve just published our weekly Bespoke Report newsletter, which is available to subscribers across all three of our membership levels. You can read it now by choosing a membership option and starting a two-week free trial at this page. Below is one of many graphics included in our weekly newsletter. This specific one shows recent performance across asset classes using key ETFs traded on US exchanges.
We go into much more detail in the newsletter, but quickly — note how well US stocks did in May versus the rest of the world.
To find out what this trend of US outperformance means, choose any membership option and access this week’s full Bespoke Report newsletter after signing up! You won’t be disappointed.
Bespoke Beige Book Index Suggests 3-4% GDP Growth
Last month we introduced the Bespoke Beige Book Sentiment Index, a quantitative assessment of the qualitative language used in the Fed’s Beige Book, updated twice per quarter. Earlier this week we updated that index for Bespoke Institutional subscribers. We’ve charted the index below. As shown, it’s accelerated quite dramatically in recent months and its current level is consistent with sustained growth in the neighborhood of 3-4%.
Our new Beige Book Sentiment Index will be released in the moments after the Beige Book release twice per quarter (or eight times per year). Access to this new economic indicator and its sub-indices is only available at the Bespoke Institutional subscription level, which you can start a free trial to here. If you have any questions about the Bespoke Beige Book Sentiment Index, please submit a contact form at our About page.
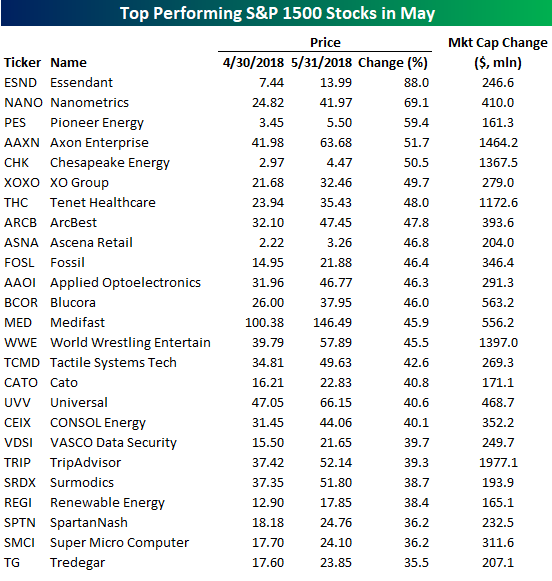
Top Performing Stocks in May
By just about any account, the month of May was a good one for US equities. The S&P 500 was up over 2%, which was the best month since January, while small caps did even better as the Russell 2000 rallied close to 6% for its best month since September of last year. With small caps doing so well, a number of lesser-known stocks posted huge gains. In the S&P 1500 alone, 93 stocks were up over 20% in May, while 25 stocks were up over 35%. The table below lists those 25 stocks that rallied more than 35%, and looking through the names, we wouldn’t fault you for not being familiar with most, if not all of them.
Just to illustrate, the rightmost column below shows how much each of the top performing stocks listed below gained in market cap during the month. Of these, just five saw a market cap increase of more than $1 billion, and the average increase of the 25 stocks was just $538 million. When a stock rallies 40% or 50% and sees its market cap increase by just a couple of hundred million, you know it’s not a very big company. Collectively, these 25 names saw their market caps increase by $13.5 billion.
Looking at performance another way. The table below shows the fifteen stocks in the S&P 1500 that saw their market cap increase by more than $10 billion during the month of May. Topping the list of winners was Apple (AAPL) with a market cap gain of just under $80 billion, and rounding out the top three were Facebook (FB) and Alphabet (GOOGL) which both saw their market caps increase by over $50 billion. On a combined basis, the fifteen companies listed below were up a rather pedestrian 10.5%, but in terms of market cap, they collectively gained just under $400 billion, or 30 times the gain of the 25 biggest percentage movers in the S&P 1500!

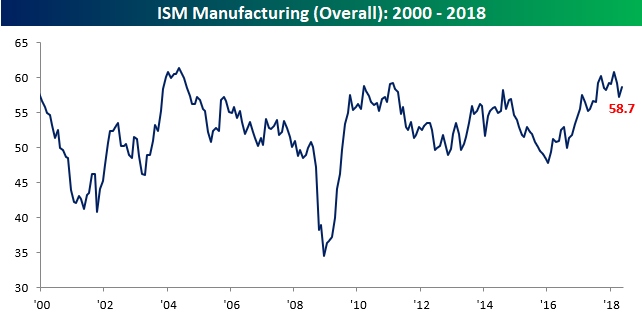
ISM Bounce Back in Manufacturing
After two straight months of declines, the ISM Manufacturing report bounced back nicely in May, rising from 57.3 up to 58.7 and above the consensus forecast for an increase to 58.2. While the index is off of its recent highs, relative to history, it is still at very high levels.
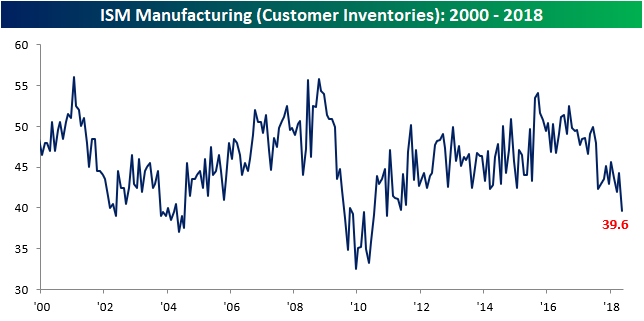
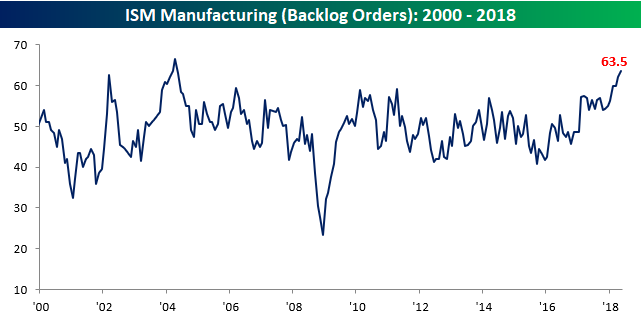
Not only was the headline reading positive, but breadth was also strong. As shown in the table below, six of the index’s ten sub-components were up m/m and seven were up y/y. The biggest m/m gains this month came from Production and New Orders, while the largest declines were in Customer Inventories and Import Orders. In the case of Customer Inventories, that index is at its lowest level since December 2010. Also notable is the trend in Backlog Orders. Even though it didn’t see one of the largest increases, that index is now at its highest level since April 2004! Finally, with just about everyone concerned about inflation these days, Prices Paid did increase to its highest level since 2011, but the pace of increase definitely slowed.
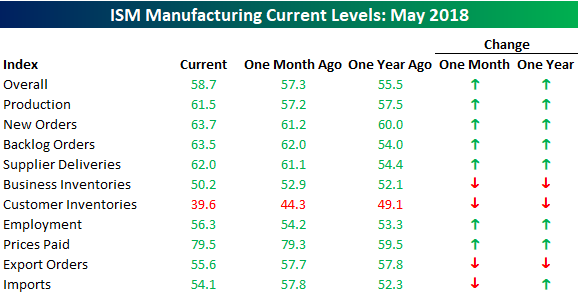

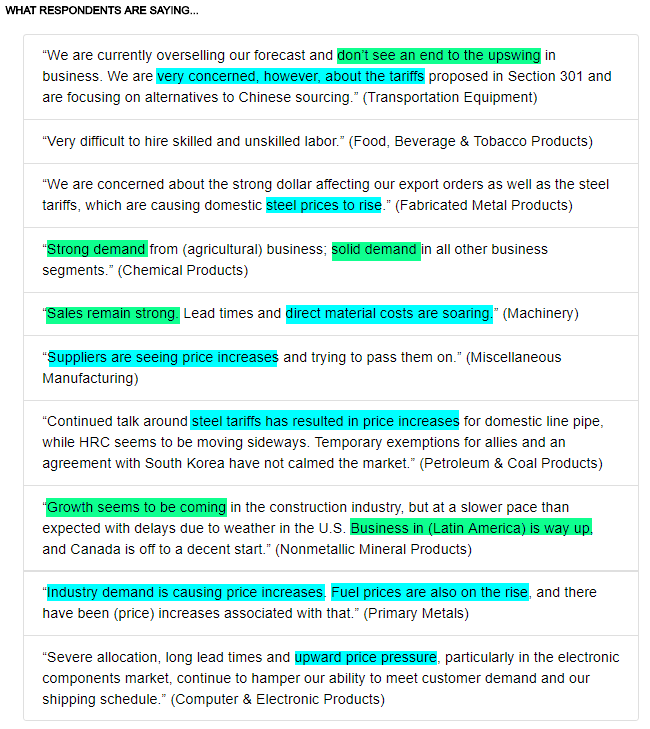
Finally, with respect to what the respondents are saying, the table below is from this month’s release and shows that while business remains very strong (green highlights), concerns about rising prices are more than present.
Ford Truck Sales Inching Closer to a Record Pace
Ford just released monthly sales figures for the month of May, and while analysts were expecting a small drop (-1.9%) in sales, the company actually managed to post a modest gain (0.7%). In addition to the better than expected headline reading, Ford also posted strong sales of F-Series trucks. Not only are sales of F-series trucks important for Ford (higher margin), but they are also a good economic barometer. The reason? Trucks are often purchased by small businesses and contractors, so they provide a good read on the health of the small business sector. Based on these sales totals, small businesses continue to do well, which is a good sign for the economy. Overall in May, Ford sold 84,369 F-Series trucks, which is the second best reading for the month of May since 1996! The only year where Ford sold more F-Series trucks in the month of May was 2000 when total sales were 85,506.

With such a strong May sales total, YTD sales are inching closer to a record high pace of sales. With total sales of 371,934 so far on the year, the only year where the company sold more F-Series trucks in the first five months of the year was in 2000 (387,724).

The Closer — US Data Potpourri, Canada GDP, North American Trade War, EIA — 5/31/18
Log-in here if you’re a member with access to the Closer.
Looking for deeper insight on markets? In tonight’s Closer sent to Bespoke Institutional clients, we review a range of US data released today including personal income and spending, real manufacturing & trade sales, and the outlook for ISM manufacturing data tomorrow. We also take a look at Canadian GDP, developments in NAFTA trade policy, Italy’s new government, and EIA weekly data.

See today’s post-market Closer and everything else Bespoke publishes by starting a 14-day free trial to Bespoke Institutional today!