Bespoke’s Global Macro Dashboard — 6/6/18
Bespoke’s Global Macro Dashboard is a high-level summary of 22 major economies from around the world. For each country, we provide charts of local equity market prices, relative performance versus global equities, price to earnings ratios, dividend yields, economic growth, unemployment, retail sales and industrial production growth, inflation, money supply, spot FX performance versus the dollar, policy rate, and ten year local government bond yield interest rates. The report is intended as a tool for both reference and idea generation. It’s clients’ first stop for basic background info on how a given economy is performing, and what issues are driving the narrative for that economy. The dashboard helps you get up to speed on and keep track of the basics for the most important economies around the world, informing starting points for further research and risk management. It’s published weekly every Wednesday at the Bespoke Institutional membership level.
You can access our Global Macro Dashboard by starting a 14-day free trial to Bespoke Institutional now!

The Closer — EM Update, For NAFTA Naught, JOLTs Jangle On — 6/5/18
Log-in here if you’re a member with access to the Closer.
Looking for deeper insight on markets? In tonight’s Closer sent to Bespoke Institutional clients, we take a look at emerging market local currency debt, currency, and equity markets. We also review NAFTA negotiations and US economic data today.

See today’s post-market Closer and everything else Bespoke publishes by starting a 14-day free trial to Bespoke Institutional today!
Software: The Other Leg of the Tech Juggernaut
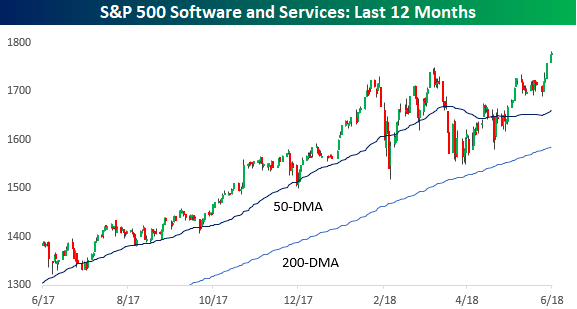
On Monday, we talked about how the Technology sector’s weight in the S&P 500, while already high, continues to expand. Earlier today, we highlighted the strength in the semiconductor group, which has helped to contribute to the Tech sector’s gains. Just as impressive as semis, though, has been the strength in stocks from the Software & Services Industry Group. Unlike the semis, the Software and Services Industry Group is trading at new 52-week highs again, rallying 14% on the year.
Mentioning that the Software and Services Industry Group is up 14% on the year doesn’t even do the group justice. That’s because some of the smaller, lesser-known names in the group have really been on fire this year. The table below lists the top performing stocks in the Russell 3000 Software and Services Industry Group so far in 2018. Of the 164 stocks in the group, 25 of them are up at least 50% YTD, and two of them have more than doubled. Leading the way higher, shares of Twilio (TWLO) are up 142% YTD and have seen a roller coaster ride over the last couple of years. After its IPO in the summer of 2016, the stock rallied from $25 all the way up to $70, only to give it all back and then some as it dropped back below $25. Since its most recent low in early February, though, the stock has more than doubled in less than four months!
Looking through the list of names below, there are certainly a handful like Twitter (TWTR), GrubHub (GRUB), etc. that you may have heard of, but the majority of these names are probably foreign to most investors. That said, while they may not be mainstream names, they certainly aren’t microcaps. Of the 25 names listed, the average market cap is actually $4 billion for a combined market cap of $100 billion. That’s no small change!
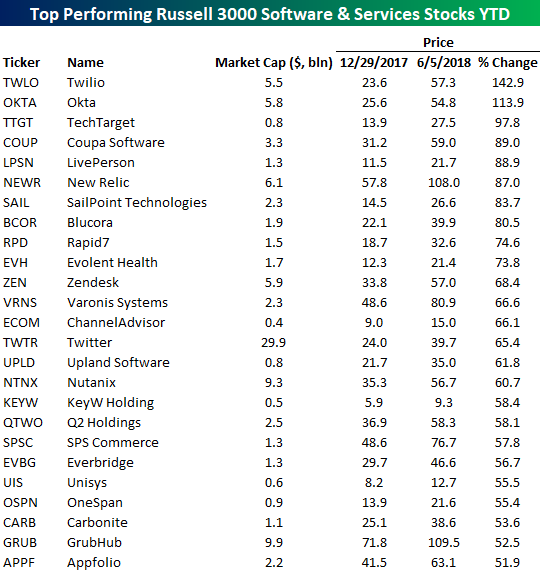
Chart of the Day: Less Selling Into The Close
Knock Your SOX Off
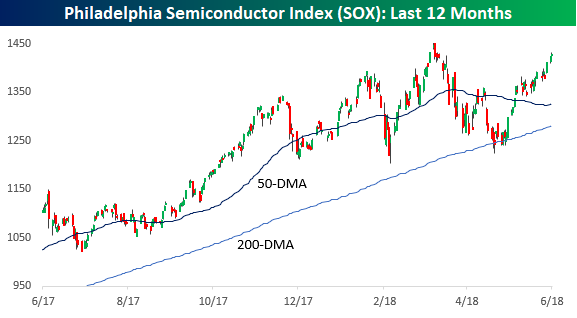
Although the Philadelphia Semiconductor Index (SOX) wasn’t able to close at a new high on Monday, it came very close (within 2%). While the index wasn’t able to take out its March highs, it remains up 14% YTD and comfortably above its highs from January when the overall market peaked.
The table below breaks down each of the components of the SOX index and how they have performed so far this year. Topping the list is Micron (MU) which had one of its best months on record in May and is now up over 45% on the year. Right behind MU, lesser-known SMART Global is up just over 45% as well. Not bad for just over five months. Rounding out the top five, Advanced Micro (AMD), NVIDIA (NVDA), and Mellanox Technologies (MLNX) are all up over 30%. Going through the list, it’s pretty amazing how well the stocks in this group have done this year, especially when you consider that the broader market is only up a couple of percentage points. On the downside, just three stocks in the group are in the red for the year.

Dorsey’s Duo Giving FAANG a Run
Last October we published a post titled “Dorsey’s Duo Not Doing So Bad.” At the time, Twitter (TWTR) CEO Jack Dorsey was taking heat because the stock was down 30% from its IPO price. But payment-processing company Square (SQ) — the other company Jack Dorsey runs — was on fire. While TWTR was down 30%, Square (SQ) was up 263%.
Fast forward eight months to today — shares of Square have nearly doubled since last October (they’ve gone from $32 to $61), while Twitter (TWTR) is up 122%!
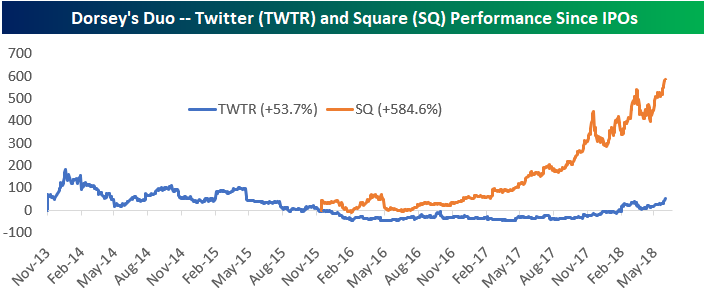
As shown below, TWTR shares are now up 53.7% from their IPO price, while SQ shares are up 584.6%.
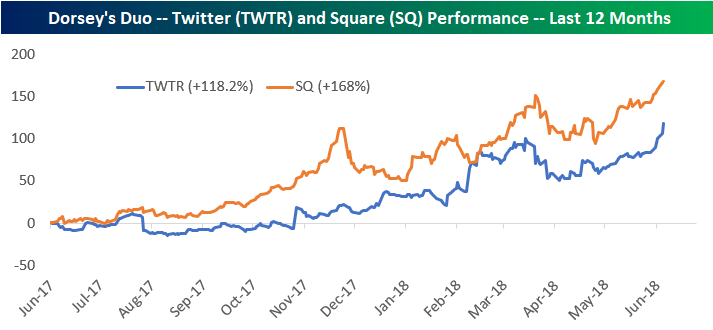
Over the last year, TWTR is now up 118.2%, while SQ is up 168%:
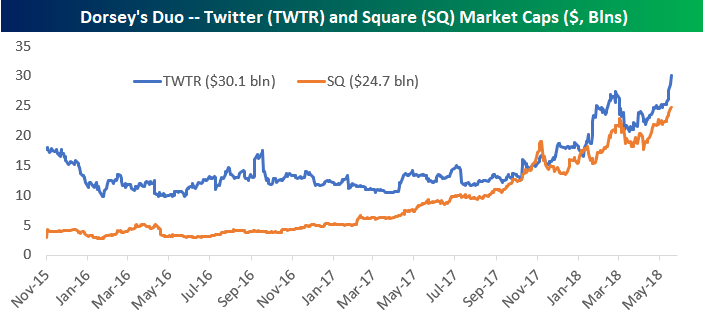
Looking at market caps, as of this morning when TWTR traded up to $40 on news that it was being added to the S&P 500, the company was worth $30.1 billion. Square (SQ) is not too far behind at $24.7 billion.
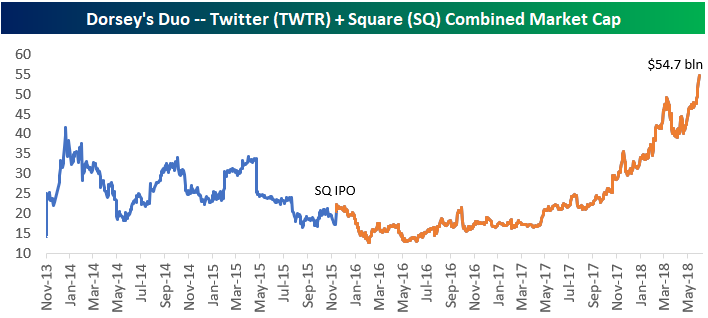
On a combined basis, “Dorsey’s Duo” of TWTR and SQ are now worth $54.7 billion. A year ago they were worth less than $20 billion.
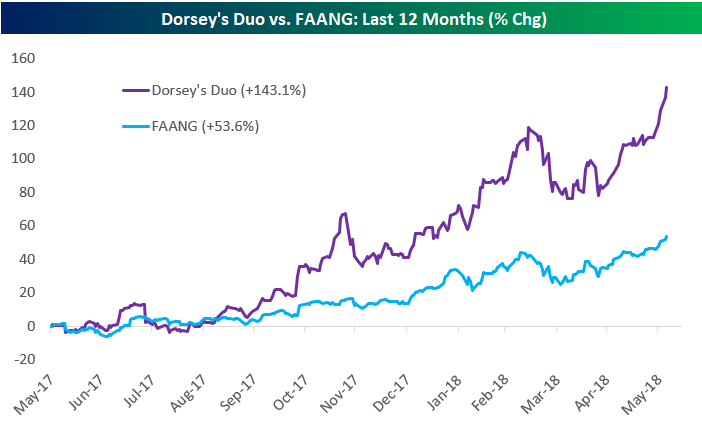
The “FAANG” stocks have the fun acronym, but Dorsey’s Duo of TWTR and SQ are actually performing better. SQ is up more than any FAANG stock over the last year, while TWTR is ahead of all the FAANG stocks except NFLX, which is up 126% vs. TWTR’s gain of 118%.

Looking at TWTR and SQ vs. the portfolio of five FAANG stocks, the 12-month change is not even close. Dorsey’s Duo is up 143%, while FAANG is up 53.6%.
How quickly things can change. Jack Dorsey was being heavily criticized for trying to run two companies at once last year at this time. Now? Crickets.
May 2018 Headlines
ISM Services Report Tops Expectations
Similar to the ISM Manufacturing report which bounced back from two straight months of m/m declines, the ISM Non-Manufacturing report also rebounded in May, erasing a three-month streak of losses. While economists were forecasting the headline index to come in at 57.7, the actual reading was much stronger at 58.6. With the strong readings in both the Manufacturing and Non-Manufacturing reports, the combined ISM for the month of May also rebounded to 58.6 from 56.9. While both of these series are off of their recent highs, they are still high relative to history and trending in the right direction.
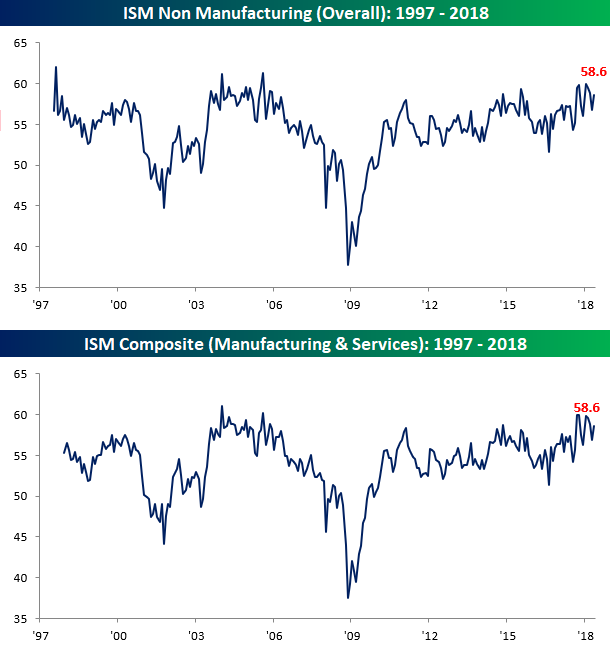
Looking at the details of this month’s report, breadth was strong. On a month/month basis, the only two components that declined were Export Orders and Import Orders. Of the eight components that saw increases, the biggest gainers were Backlog Orders and Supplier Deliveries. Breadth on a y/y basis was also strong as the only two components that declined were Inventory Sentiment and Employment.

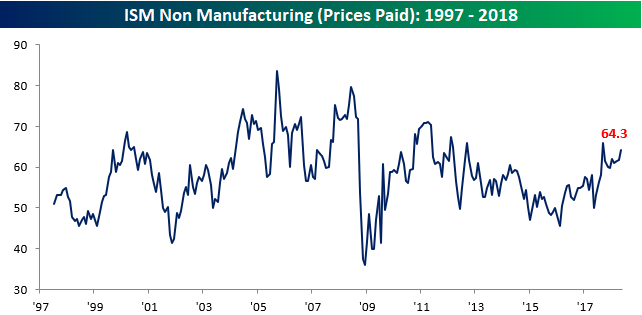
Two sectors worth attention this month were Prices Paid and Backlog Orders. As shown in the first chart, while Prices Paid is still off of its highs from last September, it has begun to turn higher again.
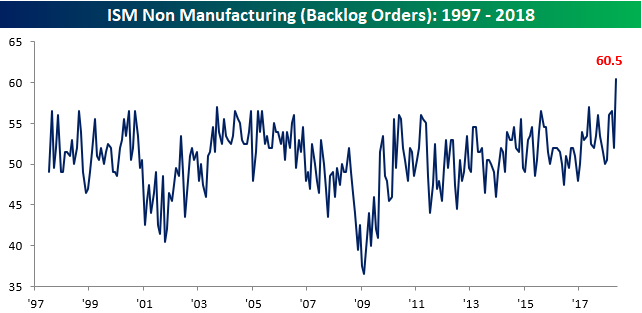
Backlog Orders surged this month to their highest level on record, which could be indicative of further pricing pressures ahead. In fact, this month’s 8.5 point increase in that component was the largest m/m increase since March 2010.
Bespoke Stock Scores — 6/5/18
The Closer — Pauses — 6/4/18
Log-in here if you’re a member with access to the Closer.
Looking for deeper insight on markets? In tonight’s Closer sent to Bespoke Institutional clients, we consider corrections in time and price, along with reviewing how strong the market has been over various time periods relative to the historic average.
See today’s post-market Closer and everything else Bespoke publishes by starting a 14-day free trial to Bespoke Institutional today!