Bespoke’s Sector Snapshot — 7/26/18
We’ve just released our weekly Sector Snapshot report (see a sample here) for Bespoke Premium and Bespoke Institutional members. Please log-in here to view the report if you’re already a member. If you’re not yet a subscriber and would like to see the report, please start a two-week free trial to Bespoke Premium now.
Below is one of the many charts included in this week’s Sector Snapshot, which shows the percentage of stocks in each sector trading above their 50-day moving averages. At the moment, 73% of S&P 500 stocks are above their 50-DMAs, which is a very healthy reading.

To find out what this means and to see our full Sector Snapshot with additional commentary plus six pages of charts that include analysis of valuations, breadth, technicals, and relative strength, start a two-week free trial to our Bespoke Premium package now. Here’s a breakdown of the products you’ll receive.
the Bespoke 50 — 7/26/18
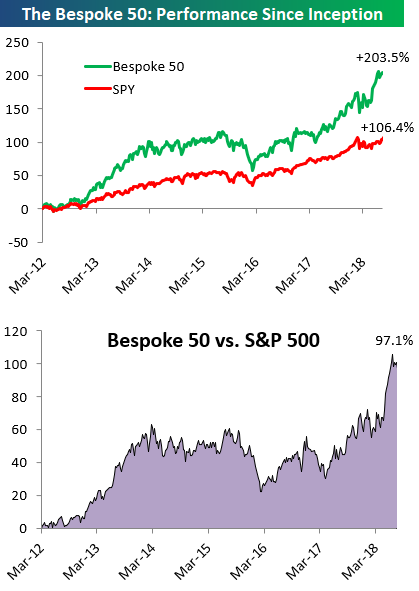
Every Thursday, Bespoke publishes its “Bespoke 50” list of top growth stocks in the Russell 3,000. Our “Bespoke 50” portfolio is made up of the 50 stocks that fit a proprietary growth screen that we created a number of years ago. Since inception in early 2012, the “Bespoke 50” has beaten the S&P 500 by 97.1 percentage points. Through today, the “Bespoke 50” is up 203.5% since inception versus the S&P 500’s gain of 106.4%. Always remember, though, that past performance is no guarantee of future returns.
To view our “Bespoke 50” list of top growth stocks, click the button below and start a trial to either Bespoke Premium or Bespoke Institutional.
No Cracks in the Jobs Market
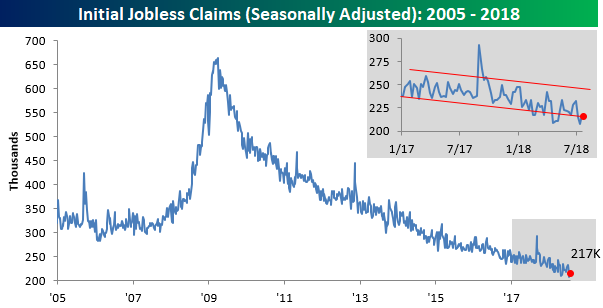
While recent residential housing data has been showing some cracks, the employment picture continues to look robust. This week’s latest read on initial jobless claims provides the latest example. Although the report came in slightly higher than expected (217K vs 215K), by just about any measure it’s an extraordinarily low reading. As we update readers every week, this week’s reading marks the 42nd straight week where claims have been at or below 250K and the record 177th straight week where claims have been under 300K.
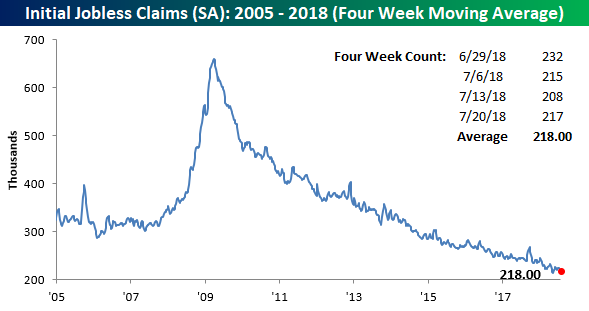
With another sub 220K reading, the four-week moving average also started to move meaningfully lower this week, falling from 220.75K down to 218K. This reading is now within 5K of its multi-decade low of 213.5K from early May, and if next week’s reading comes in below 214K, we’ll see a new low.
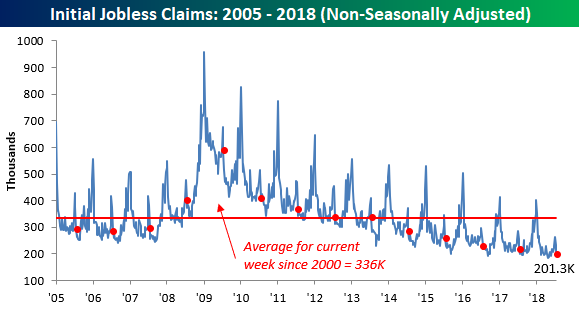
On a non-seasonally adjusted (NSA) basis, jobless claims fell from 232.2K down to 201.3K. For the current week of the year, this is the lowest reading on record, and going back to 2000, it is more than 134K below the average for the current week.
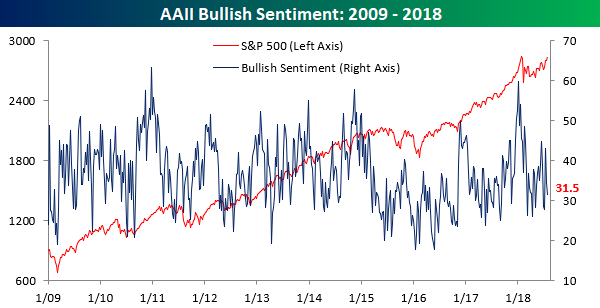
Bullish Sentiment Declines For the Second Straight Week
In the last two weeks, the S&P 500 has rallied 1.5% and broken out above significant resistance at the 2,800 level. With that kind of move, you would expect to see an uptick in optimism from individual investors. Based on the latest AAII survey data, though, we have seen the opposite. According to this week’s report, bullish sentiment declined for the second week in a row, falling from 34.66% down to 31.52%.
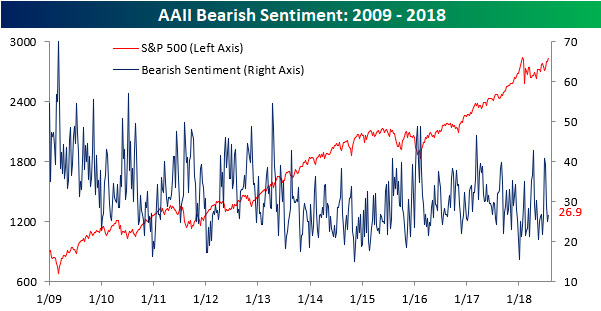
As bullish sentiment declined, bearish sentiment ticked up from just under 25% to just under 27%.
The plurality of investors, however, are still on the fence. As shown in the chart below, neutral sentiment in this week’s survey increased from 40.4% up to 41.58%. That’s the highest level since mid-May. Sentiment is a major driver of stock prices and is a topic we cover regularly in reports for clients. To stay on top of the latest sentiment trends, you can start a two-week free trial to Bespoke Institutional.

Chart of the Day: Facebook Miss To De-FAANG The Market?
The Closer — EEM > IWM, New Sales Splutter (Sort Of), Homebuilder Valuation — 7/25/18
Log-in here if you’re a member with access to the Closer.
Looking for deeper insight on markets? In tonight’s Closer sent to Bespoke Institutional clients, we note a few interesting patterns in relative index and cross-asset performance. We also review June housing market data in the form of new home sales, homebuilder valuations, and weekly data from the EIA on the status of petroleum markets.

See today’s post-market Closer and everything else Bespoke publishes by starting a 14-day free trial to Bespoke Institutional today!
Bespoke Consumer Pulse Ahead of the Curve Again
Facebook (FB) is currently on pace to have one of its worst trading days as a public company on Thursday after releasing a disappointing earnings report after the close Wednesday. The culprit for the weakness was disappointing revenue and user growth, and based on the fact that the stock hit an all-time high right before the release, investors were more than caught off guard. The fact that as recently as Wednesday morning there were reports that the quarter would be strong based on strong partner checks shows just how surprised many investors were by the Q2 report.
Subscribers to the Bespoke Consumer Pulse report from Bespoke Market Intelligence were aware of the underlying weakness in usage trends, though. The chart below was taken from our most recent report for the month of June and was derived from a question where we asked consumers which two of the major social media websites they use most. While Facebook (FB) is still far and away the leader at 64.7%, usage has been steadily trending lower for a couple of years now. The big saving grace for Facebook (FB), though, has been strength in Instagram where usage had been steadily trending higher. The problem here is that growth in usage for Instagram has also shown signs of leveling off in the mid 30% range. Even usage of WhatsApp has been stuck at or below 10% for a number of months now.

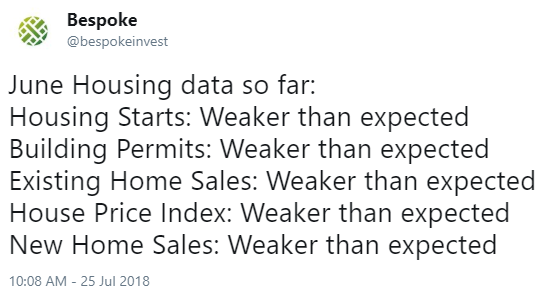
Housing Data of Horrors
Housing data that has been released this month has been absolutely brutal. Below is a tweet from our @bespokeinvest Twitter feed earlier this morning that sums up the data well:
Stock price movements are forward looking, which explains the drop we’ve been seeing in the homebuilder ETF for the last six months. As the rest of the market rebounded off of the first quarter correction lows, the homebuilder stocks continued to trend lower. A combination of rising interest rates and the Trump tax plan (which reduced deductions for many homeowners) have been a double whammy, and it’s now showing up not only in homebuilder stock prices but also in housing-related economic data.
As shown in the one-year chart for the homebuilder ETF (ITB) below, investors are looking at a pretty significant breakdown yet again if the ETF closes below $37.
While it has yet to negatively impact the rest of the stock market, continued weakness in housing will eventually get the market’s attention.
We cover housing and the rest of the economy in our daily Closer report, which you can start receiving in your inbox with two-week free trial to Bespoke Institutional. You can also monitor charts for ETFs like ITB with our popular Chart Scanner tool that’s available to Bespoke Premium and Bespoke Institutional members.
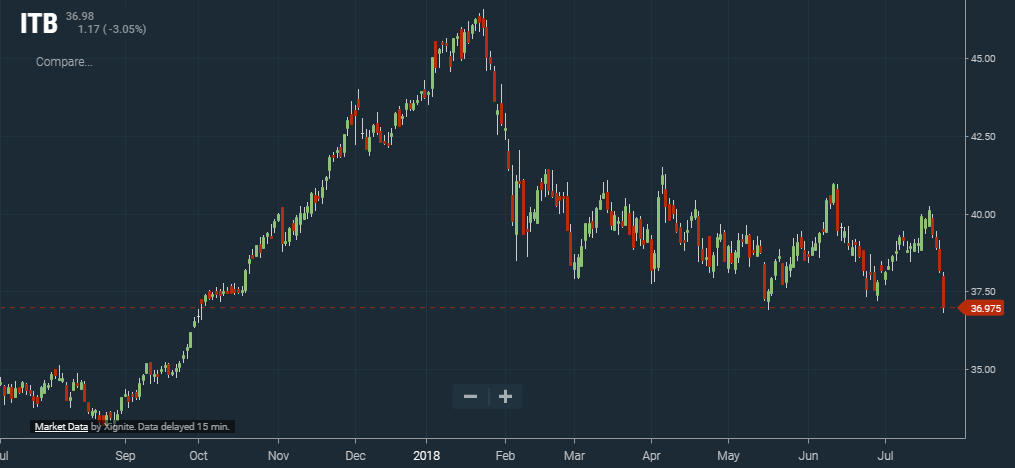
Chart of the Day: Investors Continue to Sell Domestic Equity Mutual Funds and ETFs
Fixed Income Weekly – 7/25/18
Searching for ways to better understand the fixed income space or looking for actionable ideals in this asset class? Bespoke’s Fixed Income Weekly provides an update on rates and credit every Wednesday. We start off with a fresh piece of analysis driven by what’s in the headlines or driving the market in a given week. We then provide charts of how US Treasury futures and rates are trading, before moving on to a summary of recent fixed income ETF performance, short-term interest rates including money market funds, and a trade idea. We summarize changes and recent developments for a variety of yield curves (UST, bund, Eurodollar, US breakeven inflation and Bespoke’s Global Yield Curve) before finishing with a review of recent UST yield curve changes, spread changes for major credit products and international bonds, and 1 year return profiles for a cross section of the fixed income world.
The USD is broadly over-valued per The Economist‘s Big Mac Indices, but are those helpful as a return signal for FX? We discuss.

Our Fixed Income Weekly helps investors stay on top of fixed income markets and gain new perspective on the developments in interest rates. You can sign up for a Bespoke research trial below to see this week’s report and everything else Bespoke publishes free for the next two weeks!
Click here and start a 14-day free trial to Bespoke Institutional to see our newest Fixed Income Weekly now!