The House of the Future: Kitchen-less!
It used to be that if you walked into any house, there was always a formal dining room and living room. As life has become more modern and informal, though, the formality of a living room, where everything had to be pristine and seemed to be meant for anything besides ‘living’ in, has become less important. Similarly, in many more modern or newly renovated houses, formal dining rooms are less common. Instead, dining rooms have become part of the kitchen to create one bigger more informal gathering room. After looking at this month’s Retail Sales report, we wonder if the house of the next generation will even have a kitchen at all!
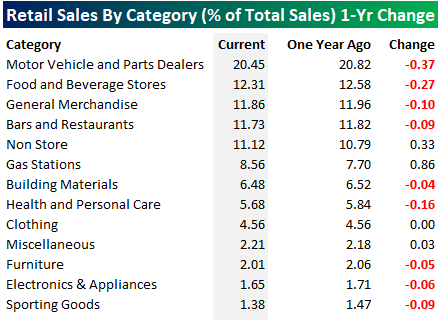
The table below shows the various groups that comprise retail sales and what share each sector accounts for in terms of total sales. Topping the list at over 20% is Motor Vehicles and Parts, but right behind Motor Vehicles is Food and Beverage Stores at 12%. Everyone has to eat, so it makes perfect sense that Food & Beverage Stores account for such a large chunk of total sales. While everyone has to eat, where they eat is another story, and not far behind Food & Beverage Stores in terms of total sales is Bars and Restaurants at 11.7%.
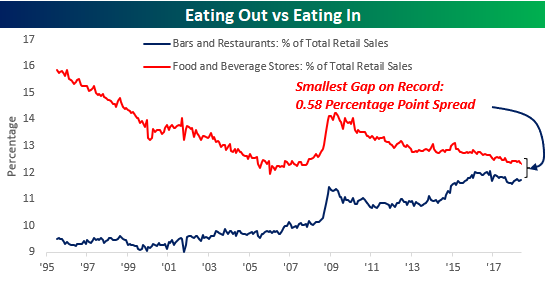
The chart below compares the historical share of total sales that eating in (Food and Beverage Stores) and eating out (Bars and Restaurants) have accounted for. With “Eating In” accounting for 12.31% of total sales and “Eating Out” accounting for 11.73%, the 0.58 percentage point gap between the two categories is the narrowest it has ever been. What’s even more fascinating about the shift in eating trends over the last 20+ years is the fact that even as Americans have changed where they eat (out vs home), the percentage of total sales that “food and beverage” account for has held steady. Combined, the two categories currently account for 24.05% of total retail sales, and that compares to a historical average of 23.64% going all the way back to 1995.
In the house of the future, what will replace the kitchen?
Sweet Sixteen For Empire Manufacturing
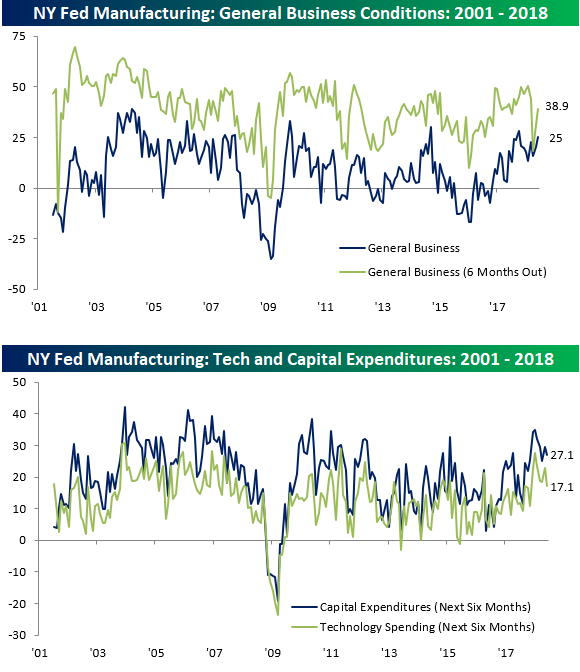
Today’s Empire Manufacturing report for the month of June came in higher than expected with the headline General Business Conditions Index hitting its highest level since October. While economists were forecasting the headline number to come in at a level of 18.8, the actual reading came in at 25.0. This month’s report also marked the 16th straight month that the Empire Manufacturing report has been positive. As the chart below indicates, the index for current conditions (dark blue line) is just over three points below its high for the cycle. Meanwhile, expectations for six months from now, which had cratered in March, has since rebounded nearly all of the ground it originally lost.
The second chart below shows plans for CapEx and Technology Spending over the next six months. Unlike the expectations index for general business conditions, which has bounced back, these two indices continue to drift lower. In fact, plans for Technology spending haven’t been lower than they are now since last August.
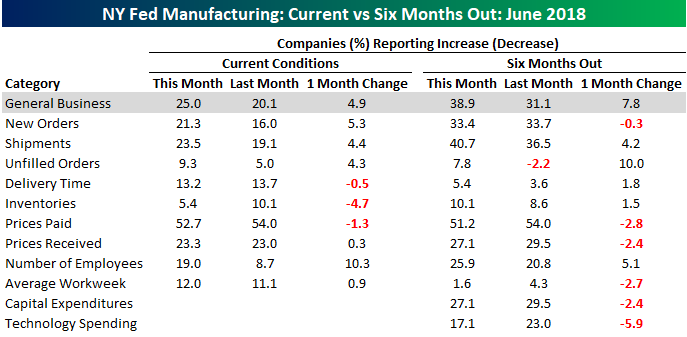
The table below breaks down the internals of this month’s report by each of the index’s sub-components. As shown, the indices for current conditions mostly increased in June, while expectations for six months from now weren’t quite as strong. The biggest increases in the current conditions index came from Number of Employees, which saw its largest one-month increase since last September. Also, while the magnitude of the increases wasn’t nearly as large, both New Orders and Shipments saw sizable increases.
Longer Term Asset Class Total Returns
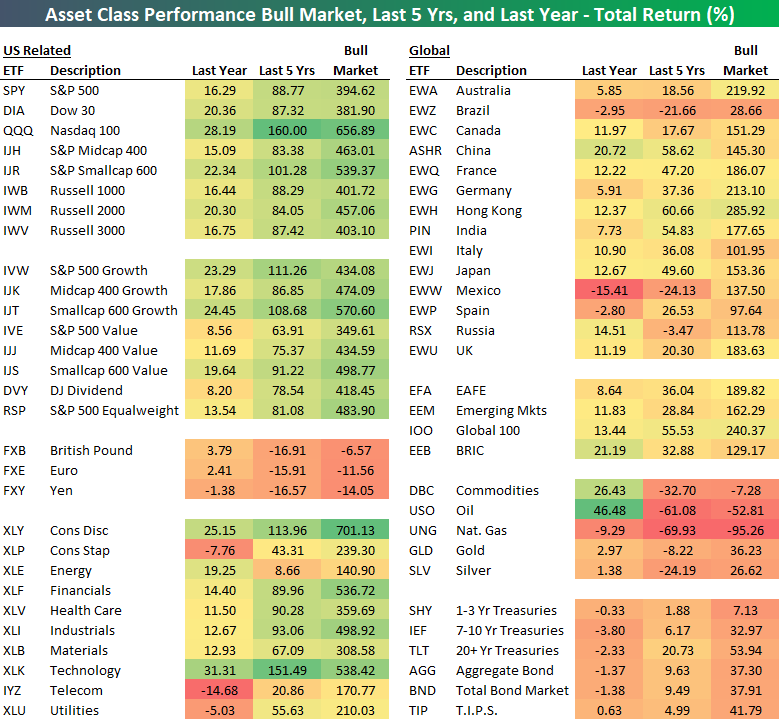
Below is an updated look at total returns for various asset classes using key ETFs traded on US exchanges. We cover three time frames — the last year, the last five years, and since the bull market began on March 9th, 2009.
Over the last year, we’ve seen double-digit percentage gains across the board for US index ETFs. Note that small caps have handily outperformed large caps, while the Nasdaq 100 (QQQ) has done much better than SPY and DIA.
From a sector perspective, we’ve seen defensive sectors (Staples, Utilities, Telecom) actually fall over the last year, while Technology and Consumer Discretionary have led the way.
International equity market ETFs have been weaker than US index ETFs on a relative basis. The Global 100 (IOO) and EAFE (EFA) ETFs are up 13.44% and 8.64% over the last year, while countries like Brazil (EWZ), Spain (EWP), and Mexico (EWW) are in the red.
The oil ETF (USO) has actually been the top performing asset class over the last year in the entire matrix with a gain of 46.48%. Since the bull market began, though, USO is still down more than 52%!
In terms of commentary, we’ll skip past the 5-year returns and next look at bull market returns. The results are eye-popping.
The S&P 500 (SPY) ETF is now up 394.6% since the bull market began on March 9th, 2009. The Nasdaq 100 (QQQ) is up much more at +656.9%!
Looking at sectors, Consumer Discretionary (XLY) leads the way with a total return of more than 700%, followed by Tech (XLK) and Financials (XLF), which have both posted gains of more than 530%. The Energy sector (XLE) is up the least since the bull market began at +140%.
Returns are much lower for country ETFs since 3/9/09. The best country in our matrix is Hong Kong (EWH) with a gain of 285.9%, which is more than 100 percentage points less than the S&P 500.
The worst performing asset class in the matrix since the bull market began is natural gas (UNG), which is down 95%.
The Closer — ECB Recap, EZ Wages, Brazil Troubles, Import Price Trundles — 6/14/18
Log-in here if you’re a member with access to the Closer.
Looking for deeper insight on markets? In tonight’s Closer sent to Bespoke Institutional clients, we talk about the huge decline in EUR. Ending QE, but not dovishly: that was the story of the ECB meeting today. We recap that event, the market reaction, and the acceleration in Eurozone wages reported yesterday. We also discuss the situation in Brazil and the ongoing acceleration in US import prices reported today.

See today’s post-market Closer and everything else Bespoke publishes by starting a 14-day free trial to Bespoke Institutional today!
Chart of the Day: Global Central Bank Balance Sheets Growing Slower
Bespoke’s Sector Snapshot — 6/14/18
We’ve just released our weekly Sector Snapshot report (see a sample here) for Bespoke Premium and Bespoke Institutional members. Please log-in here to view the report if you’re already a member. If you’re not yet a subscriber and would like to see the report, please start a two-week free trial to Bespoke Premium now.
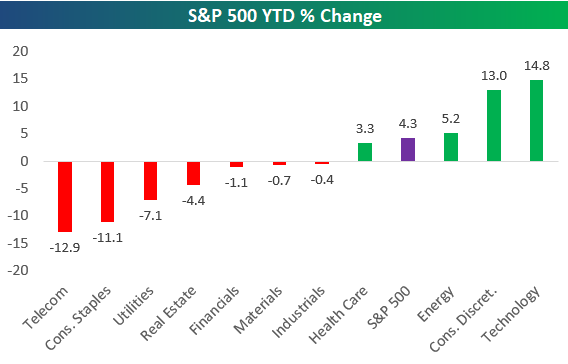
Below is one of the many charts included in this week’s Sector Snapshot, which shows the YTD percentage change of the eleven S&P 500 sectors. As shown, Technology and Consumer Discretionary are currently in a race for first place, with Tech currently in the lead and Consumer Discretionary right on Tech’s heels.
To find out what this means and to see our full Sector Snapshot with additional commentary plus six pages of charts that include analysis of valuations, breadth, technicals, and relative strength, start a two-week free trial to our Bespoke Premium package now. Here’s a breakdown of the products you’ll receive.
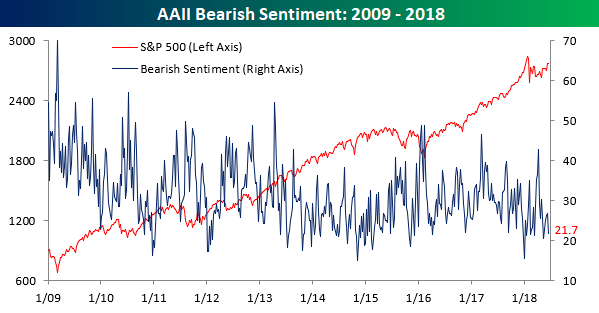
Four-Month High In Bullish Sentiment
Bulls are on the offensive this week as AAII Bullish sentiment jumped to 44.78% from 38.93% last week, which is the highest level since mid-February. Bullish sentiment had been gradually trending higher in recent weeks, but this week’s jump represents a breakout from that pace.
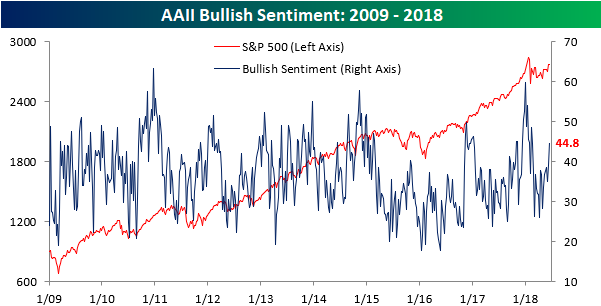
While bullish sentiment spiked higher, bearish sentiment did not see as big of a move to the downside. As shown in the chart below, negative sentiment declined from 26.72% down to 21.70%. That’s only the lowest reading since mid-May.
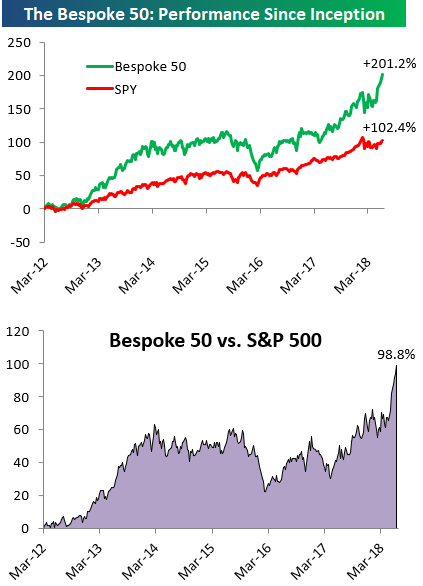
the Bespoke 50 — 6/14/18
Every Thursday, Bespoke publishes its “Bespoke 50” list of top growth stocks in the Russell 3,000. Our “Bespoke 50” portfolio is made up of the 50 stocks that fit a proprietary growth screen that we created a number of years ago. Since inception in early 2012, the “Bespoke 50” has beaten the S&P 500 by 98.8 percentage points. Through today, the “Bespoke 50” is up 201.2% since inception versus the S&P 500’s gain of 102.4%. Always remember, though, that past performance is no guarantee of future returns.
To view our “Bespoke 50” list of top growth stocks, click the button below and start a trial to either Bespoke Premium or Bespoke Institutional.
The Closer — Fed Hikes, PPI Spikes, EIA Improvement — 6/13/18
Log-in here if you’re a member with access to the Closer.
Looking for deeper insight on markets? In tonight’s Closer sent to Bespoke Institutional clients, we recap the Fed’s second hike of the year and the outlook now for four hikes across the next six months of 2018. We also review PPI and weekly EIA data.
See today’s post-market Closer and everything else Bespoke publishes by starting a 14-day free trial to Bespoke Institutional today!
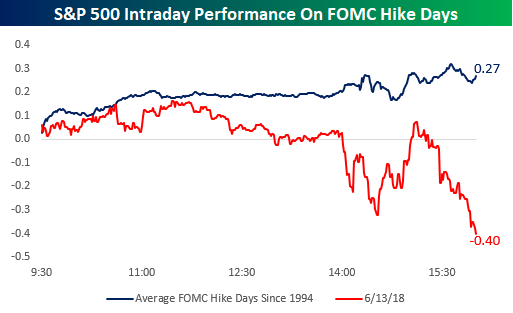
Not Your Typical FOMC Day
Without even getting into the crazy intraday swings we saw in emerging market indices like Brazil’s Ibovespa, today’s market action was not the type normally seen on days when the Fed hikes rates. The chart below compares today’s intraday performance of the S&P 500 to all other Fed rate hike days since 1994. As shown with the blue line in the chart, the S&P 500 has seen an average gain of 0.27% on historical rate hike days. On those days, the S&P 500 typically trades higher leading up to the announcement, then sees some volatility following the announcement, but ultimately finishes the day slightly higher than it was right before the decision was announced.
Today’s action was completely different. While the S&P 500 was up early in the trading day, it began to lose steam well before the 2 PM announcement and then saw a sharp intraday decline right after the announcement. From there, it looked like we were going to see a similar move to the typical FOMC hike day as the S&P 500 went back into the green shortly after 3 PM. Right after the S&P 500 moved into positive territory, though, the sellers stepped in, and we finished at the lows of the day with a decline of 0.40%. It’s never a good feeling to go out at the lows of the day, but tomorrow is another day!