the Bespoke 50 — 6/21/18
Every Thursday, Bespoke publishes its “Bespoke 50” list of top growth stocks in the Russell 3,000. Our “Bespoke 50” portfolio is made up of the 50 stocks that fit a proprietary growth screen that we created a number of years ago. Since inception in early 2012, the “Bespoke 50” has beaten the S&P 500 by 105.8 percentage points. Through today, the “Bespoke 50” is up 205.7% since inception versus the S&P 500’s gain of 99.9%. Always remember, though, that past performance is no guarantee of future returns.
To view our “Bespoke 50” list of top growth stocks, click the button below and start a trial to either Bespoke Premium or Bespoke Institutional.
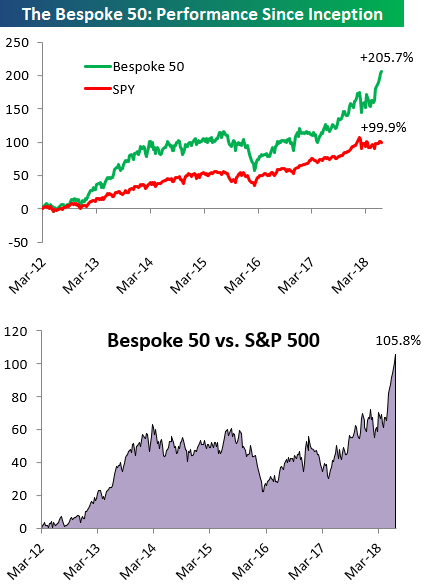
Chart of the Day: Growth Continues To Eat Value For Breakfast
Biggest Miss in Philly Fed in Over Two Years
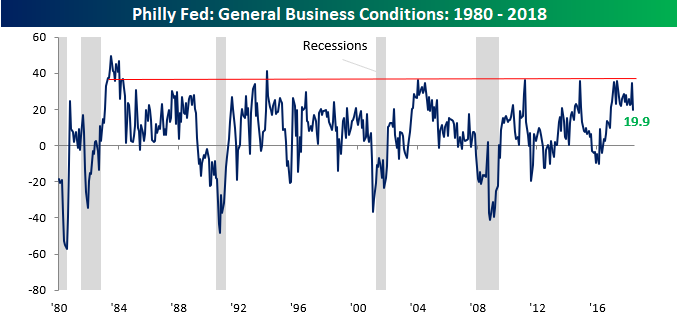
Today’s Philadelphia Fed Manufacturing report was a disappointment for a number of reasons. For starters, the headline reading came in weaker than expected, coming in at a level of 19.9 vs estimates for a reading of 29.0. Relative to expectations, that was the biggest miss since April 2016. The other reason the report was disappointing was that it dropped below 20 for the first time since November, ending a record streak of 18 months above 20. As shown in the chart below, and as we’ve discussed in the past, the headline Philly Fed Index reached levels that in the past haven’t been sustainable for more than a few months. The fact that it took this long to pull back was probably the biggest surprise.
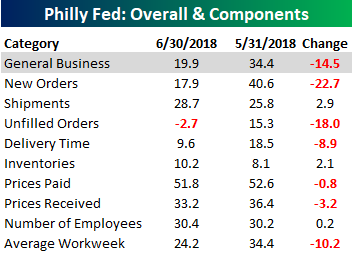
The table below breaks down this month’s report by each of the index’s subcomponents. Weakness — or better put, slower growth — was broad-based in this month’s report as all but three sub-components saw month/month declines. Additionally, while there were some pretty significant declines, the magnitude of the components showing gains (Shipments, Inventories, and Number or Employees) were all modest.
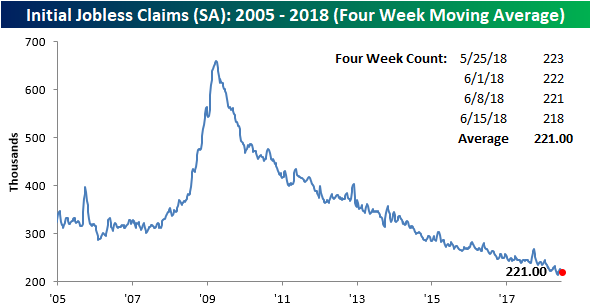
Jobless Claims Remain Low
Jobless Claims came in modestly lower than expected this week, falling from 221K down to 218K. This week’s print marks the record 172nd straight week of sub-300K claims and the 37th straight week where claims have been at or below 250K.
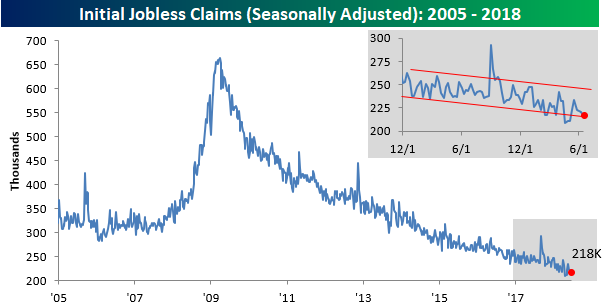
While jobless claims remain right near historic lows, the four-week moving average is 7.5K above its cycle low of 213.5 from early May.
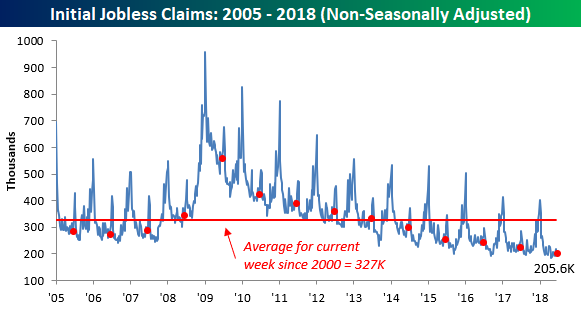
Finally, on a non-seasonally adjusted basis, jobless claims moved down to 205.6K from 217.3K last week. For the current week of the year, this week’s reading is more than 120K below the average for the current week of the year dating back to 2000 and the lowest reading for the current week of the year since 1973.
The Closer — Existing Homes, Crude Inventories Plunge, Current Account Cruising — 6/20/18
Log-in here if you’re a member with access to the Closer.
Looking for deeper insight on markets? In tonight’s Closer sent to Bespoke Institutional clients, we take a look at economic data updated today including existing home sales, EIA data, and current account balance data for Q1.

See today’s post-market Closer and everything else Bespoke publishes by starting a 14-day free trial to Bespoke Institutional today!
B.I.G. Tips – DJIA Changes
Chart of the Day: Bullish Patterns, Breaking Downtrends, and Rolling Over
Fixed Income Weekly – 6/20/18
Searching for ways to better understand the fixed income space or looking for actionable ideals in this asset class? Bespoke’s Fixed Income Weekly provides an update on rates and credit every Wednesday. We start off with a fresh piece of analysis driven by what’s in the headlines or driving the market in a given week. We then provide charts of how US Treasury futures and rates are trading, before moving on to a summary of recent fixed income ETF performance, short-term interest rates including money market funds, and a trade idea. We summarize changes and recent developments for a variety of yield curves (UST, bund, Eurodollar, US breakeven inflation and Bespoke’s Global Yield Curve) before finishing with a review of recent UST yield curve changes, spread changes for major credit products and international bonds, and 1 year return profiles for a cross section of the fixed income world.
Today we take a look at the risk premiums for interest rates priced by derivatives and spreads on fixed income assets broadly.

Our Fixed Income Weekly helps investors stay on top of fixed income markets and gain new perspective on the developments in interest rates. You can sign up for a Bespoke research trial below to see this week’s report and everything else Bespoke publishes free for the next two weeks!
Click here and start a 14-day free trial to Bespoke Institutional to see our newest Fixed Income Weekly now!
Bespoke’s Global Macro Dashboard — 6/20/18
Bespoke’s Global Macro Dashboard is a high-level summary of 22 major economies from around the world. For each country, we provide charts of local equity market prices, relative performance versus global equities, price to earnings ratios, dividend yields, economic growth, unemployment, retail sales and industrial production growth, inflation, money supply, spot FX performance versus the dollar, policy rate, and ten year local government bond yield interest rates. The report is intended as a tool for both reference and idea generation. It’s clients’ first stop for basic background info on how a given economy is performing, and what issues are driving the narrative for that economy. The dashboard helps you get up to speed on and keep track of the basics for the most important economies around the world, informing starting points for further research and risk management. It’s published weekly every Wednesday at the Bespoke Institutional membership level.
You can access our Global Macro Dashboard by starting a 14-day free trial to Bespoke Institutional now!

The Closer — Energy Seasonality, EIA vs API, Freight, Housing — 6/19/18
Log-in here if you’re a member with access to the Closer.
Looking for deeper insight on markets? In tonight’s Closer sent to Bespoke Institutional clients, we review the seasonality of WTI futures, absolute Energy equity market returns, and relative Energy equity market returns. We also review how useful API inventory reports are versus EIA inventory numbers for crude, surging transportation activity indices, and monthly residential construction numbers from the US Census.
See today’s post-market Closer and everything else Bespoke publishes by starting a 14-day free trial to Bespoke Institutional today!