The Closer — GDP Revised, Intangible Investment, Vols, & Consumer Comfort — 6/28/18
Log-in here if you’re a member with access to the Closer.
Looking for deeper insight on markets? In tonight’s Closer sent to Bespoke Institutional clients, we review GDP revisions from today, discuss the rising share of non-physical investment, highlight fixed income and cross-asset volatility trends, and discuss what’s driven the recent decline in weekly Bloomberg Consumer Comfort readings.

See today’s post-market Closer and everything else Bespoke publishes by starting a 14-day free trial to Bespoke Institutional today!
Bespoke Sector Snapshots — 6/28/18
We’ve just released our weekly Sector Snapshot report (see a sample here) for Bespoke Premium and Bespoke Institutional members. Please log-in here to view the report if you’re already a member. If you’re not yet a subscriber and would like to see the report, please start a two-week free trial to Bespoke Premium now.
Below is one of the many charts included in this week’s Sector Snapshot, which shows the relative strength of the Financials sector versus the S&P 500. When the line is falling, the sector is underperforming the S&P, and vice versa when the line is rising. Unfortunately for anyone long the Financials, a rising line hasn’t been in the cards lately. In fact, after a record streak of 13 straight daily declines, the sector’s relative strength couldn’t be much worse.
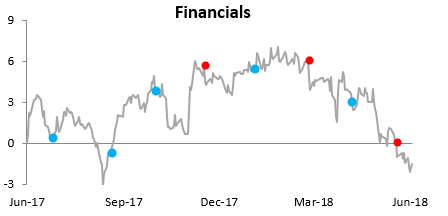
To find out what this means and to see our full Sector Snapshot with additional commentary plus six pages of charts that include analysis of valuations, breadth, technicals, and relative strength, start a two-week free trial to our Bespoke Premium package now. Here’s a breakdown of the products you’ll receive.
Contracting S&P 500 Trailing 12-Month P/E Ratio
While the S&P 500 is up about 1% year-to-date, earnings strength has caused its trailing 12-month P/E ratio to actually contract 1.78 points from 22.37 at the start of the year down to 20.59 as of this writing.
Below we show how trailing 12-month valuations have changed both year-to-date and over the last 12 months.
Year-to-date, every sector with the exception of Consumer Discretionary and Utilities has seen contraction in its P/E ratio. The Energy sector has seen the biggest contraction, but it also started the year with the second highest valuation. Along with Energy, there are five other sectors that have seen contraction of 2.5 points or more in their P/E ratios — Materials, Industrials, Consumer Staples, Telecom, and Financials.
The Technology sector is up 10% year-to-date, and even it has seen contraction in its P/E ratio due to earnings strength. As shown in the table, Tech’s P/E started the year at 23.63, and it’s now down to 22.55.
The one sector that has seen an expansion in its trailing 12-month P/E ratio is Consumer Discretionary, which has jumped 1.62 points YTD from 23.49 up to 25.12.
For more in-depth sector analysis, check out our Sector Snapshot report every Thursday as part of our Bespoke Premium service. You can join Bespoke Premium today with this 14-day free trial offer.

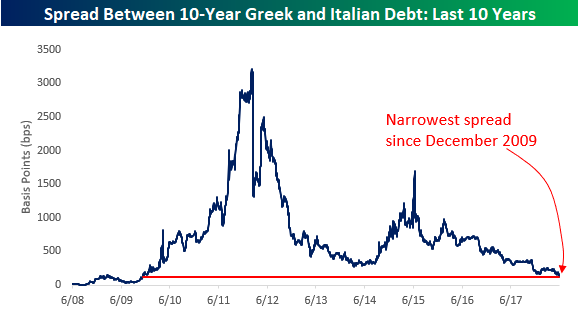
Chart of the Day: European Credit Cautionary
the Bespoke 50 — 6/28/18
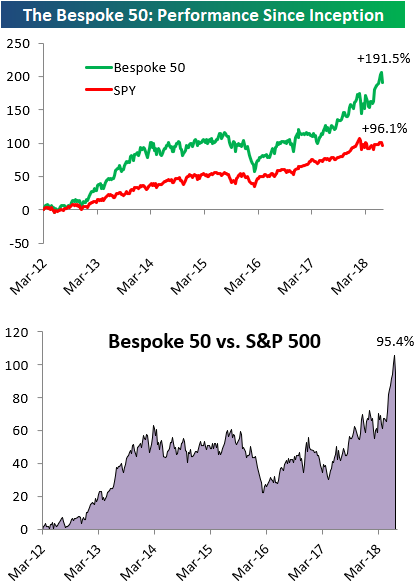
Every Thursday, Bespoke publishes its “Bespoke 50” list of top growth stocks in the Russell 3,000. Our “Bespoke 50” portfolio is made up of the 50 stocks that fit a proprietary growth screen that we created a number of years ago. Since inception in early 2012, the “Bespoke 50” has beaten the S&P 500 by 95.4 percentage points. Through today, the “Bespoke 50” is up 191.5% since inception versus the S&P 500’s gain of 96.1%. Always remember, though, that past performance is no guarantee of future returns.
To view our “Bespoke 50” list of top growth stocks, click the button below and start a trial to either Bespoke Premium or Bespoke Institutional.
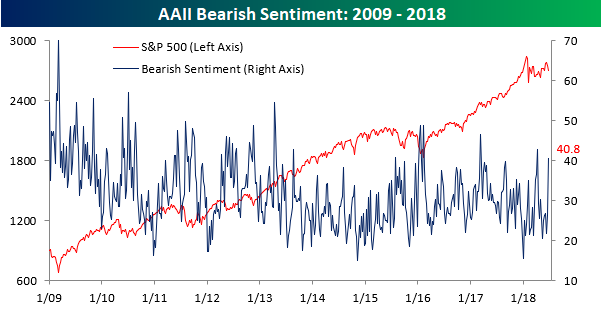
Bearish Sentiment Surges
After a few very weak days for the stock market’s leaders, individual investor sentiment really headed south this week. According to the weekly sentiment survey from AAII, bullish sentiment dropped more than ten percentage points, falling from 38.7% down to 28.4% in what was the largest one week decline since early March.
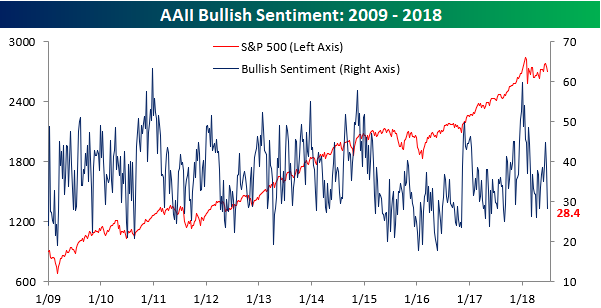
As bullish sentiment declined, bearish sentiment surged, rising from 26.2% up to 40.8% in what is only the second week in the last year where bearish sentiment has been above 40%. More importantly, though, it was the largest one week increase in negative sentiment since January 2016, which also happens to be another time when a plunging Chinese stock market was in the headlines.
The Closer — Trade Cruising, Manufacturing Not So Much — 6/27/18
Log-in here if you’re a member with access to the Closer.
Looking for deeper insight on markets? In tonight’s Closer sent to Bespoke Institutional clients, we take a look at strong trade numbers that will boost Q2 GDP substantially. We also review soft durable goods activity numbers updated today, and weekly EIA data on petroleum inventories.
See today’s post-market Closer and everything else Bespoke publishes by starting a 14-day free trial to Bespoke Institutional today!
Mexican Macro Ahead of Elections
Looking to stay on top of what’s going on in financial markets and economic data around the world? Each week, we publish our Global Macro Dashboard, a rundown of 23 different major global economies. We include equity prices, equity valuations and yields, real economic growth, unemployment, retail sales, industrial production, inflation, growth of the money supply, FX rates, and interest rates in one easily digestible packet of charts. Of course, detailed economic or financial analysis often requires deeper dives into the details, but this report is a great way to hit the high notes around the world and look for possible opportunities..
Mexico heads to the polls on Sunday in an enormously consequential election that has implications for asset markets, trade negotiations, and more (for background, our Bespokecast conversation with Horacio Coutino of ETM Analytics has you covered, link). Ahead of that election, Mexico’s stock market has underperformed badly and interest rates have risen significantly. Bond yields have risen and the Banxico has worked to fight the fall in the peso by hiking rates. While the labor market is hot (new cycle lows in unemployment), real GDP growth and industrial production have slowed. Below we show the chart pack for Mexico from this week’s Global Macro Dashboard, which is included with a subscription to Bespoke Institutional.