Looking for Action? S&P 1500 Most Volatile Stocks
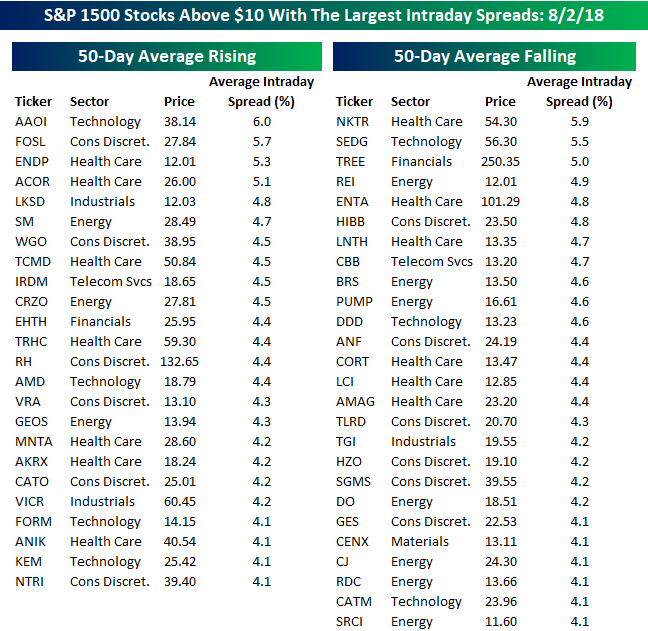
For traders with a short-term time horizon looking for big moves, we have updated our list of the S&P 1500 stocks trading above $10 that have the largest intraday high-low ranges (based on the average percent spread between the intraday high and low over the last 50 days). The stocks are grouped based on whether they have a rising or falling 50-day moving average (DMA). With the broader market trading sideways for the better part of the last six months, the fact that the list is pretty much evenly divided between stocks in uptrends and stocks in downtrends makes sense.
While we have seen some increased volatility in certain names over the last several trading days, it hasn’t been enough to cause much of an uptick in the average daily move of individual stocks. Through Thursday’s close, just seven stocks in the S&P 1500 trading above $10 per share have seen average intraday moves of over 5%. The most volatile of these six stocks is Applied Optoelectronics (AAOI), which averages an intraday range of 6%. Unlike many prior months, you may also find that many of the names near the top of both lists are stocks that you may have actually heard of as well.
With a share price of under $40, AAOI’s average daily range works out to a little bit more than $2 per share, so it isn’t particularly large in dollar terms. Two stocks listed below have share prices in the triple-digits, so their average daily dollar moves are considerably larger than AAOI. RH trades at just over $130 per share, and with an average daily range of 4.4%, its average daily move is close to $6. Likewise, Enanta Pharma (ENTA) trades at just over $100 and has an average daily range of nearly 5%.
Finally, of the 50 stocks listed, the only sectors not represented are Consumer Staples, Real Estate, and Utilities. Sectors that are the most heavily represented are Health Care (13), Consumer Discretionary (12) and Energy (10). Somewhat surprisingly, only seven stocks on the list are from the Technology sector. Not much of a showing for the largest sector of the market.
The Closer — Valuation Drawdown, Banxico Indecisive — 8/2/18
Log-in here if you’re a member with access to the Closer.
Looking for deeper insight on markets? In tonight’s Closer sent to Bespoke Institutional clients, we see what significant drawdowns in S&P 500 trailing P/E means for forward total returns. We also review today’s policy decision from the Banxico and a few data points released today.

See today’s post-market Closer and everything else Bespoke publishes by starting a 14-day free trial to Bespoke Institutional today!
Chart Scanner Screens
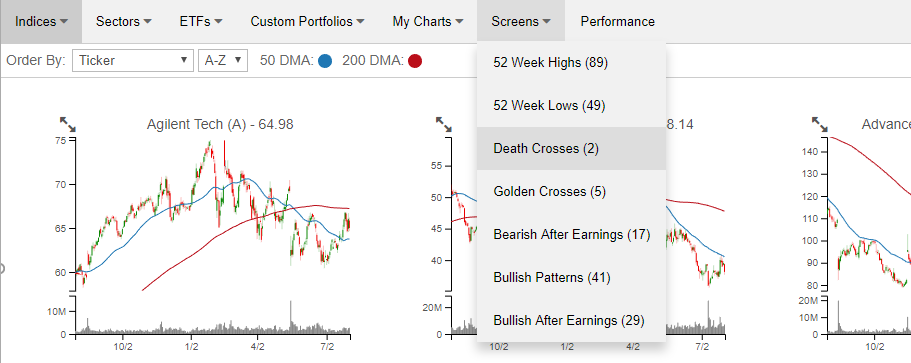
Our recently launched Chart Scanner has become an incredibly popular and useful tool for clients as it gives a user the ability to quickly scan through hundreds of charts in order to find the most attractive (or unattractive) patterns. Included with the tool are a number of pre-defined screens that allow users to see stocks that hit 52-week highs or lows in the previous session, experienced “death” or “golden” crosses, as well as charts which we view as having bullish or bearish patterns. Each of these screens can be found using the drop-down box at the top of the page (as illustrated in the image below).
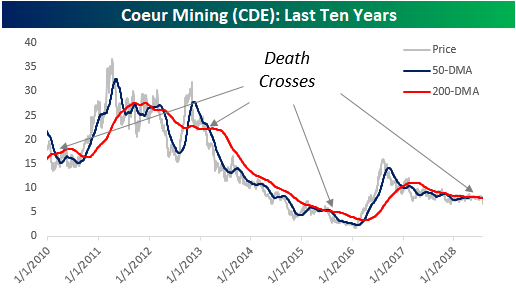
Today we wanted to provide a look at one of the two stocks that showed up on our screen of Death Crosses. That stock is Coeur Mining (CDE). If you aren’t familiar with the terms, a Golden Cross occurs when a stock’s 50-day moving average crosses above its 200-day moving average as both are rising. Conversely, a Death Cross occurs when a stock’s 50-day moving average crosses down below its 200-day moving average as both are falling. While we often note that the technical formations known as Golden and Death Crosses have a spotty record of accuracy, prior Death Crosses for CDE have been pretty bearish. The chart below shows each of the prior four Death Crosses for CDE over the last ten years (2010, 2012, 2015, and last month in June).
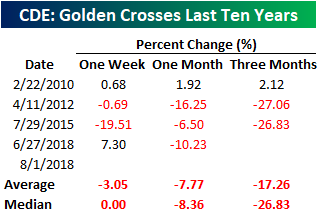
Looking at the stock’s returns following each of the prior Death Crosses for CDE, the stock has seen negative returns on both an average and median basis. One week later, the stock was down 3.1% (median: 0.0%) with gains half of the time. One month later, though, the average (-7.77%) and median (-8.36%) returns were a lot worse with only one period of gains. Finally, the average three-month change was a decline of over 17% with losses two out of three times. In the past, we have been quick to point out how bad of a timing indicator Golden and Death Crosses have often been, but in the case of CDE, Death Crosses have usually been followed with losses. As mentioned above, our Chart Scanner tool has become an incredibly popular feature of our Bespoke Premium service. To start using it now, take a two-week free trial to Bespoke Premium today!
July Employment Report Preview
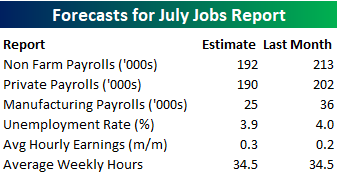
Heading into Friday’s Non-Farm Payrolls (NFP) report for July, economists are expecting an increase in payrolls of 192K, which would be a decline from June’s solid reading of 213K. In the private sector, economists are expecting an increase of 190K. The unemployment rate is expected to tick down to 3.9% after unexpectedly ticking up to 4.0% last month. Last month’s jump to 4% was taken as a signal to economists that workers were entering the workforce, so this will be an added area of focus again. Any increase in the unemployment rate without a surprisingly weak headline number will indicate a continuation of that trend and should help to keep wages from rising too fast.
Ahead of the report, we just published our eleven-page preview of the July jobs report. This report contains a ton of analysis related to how the equity market has historically reacted to the monthly jobs report, as well as how secondary employment-related indicators we track looked in July. We also include a breakdown of how the initial reading for July typically comes in relative to expectations and how that ranks versus other months.
One topic we cover in each month’s report is the S&P 500 stocks that do best and worst from the open to close on the day of the employment report based on whether or not the report comes in stronger or weaker than expected. In other words, which stocks should you buy, and which should you avoid? The table below highlights the best-performing stocks in the S&P 500 from the open to close on days when the Non-Farm Payrolls report has been better than expected over the last two years.
Of the 25 top performing stocks on days when the NFP beats expectations, seven sectors are represented, and Consumer Discretionary leads the way with nine. Vornado (VNO) has been the best performing stock with an average open to close gain of 2.54%. VNO is followed by nine other stocks that have been up 1%+. In terms of consistency, Urban Outfitters (URBN), CH Robinson (CHRW), and Michael Kors (KORS) have all been positive 90% of the time.
For anyone with more than a passing interest in how equities are impacted by economic data, this report is a must-read. To see the report, sign up for a monthly Bespoke Premium membership now!

Bespoke’s Sector Snapshot — 8/2/18
Chart of the Day: Good News, Bad News For Manufacturing Employment
Sentiment Down, But Holding Up Relatively Well
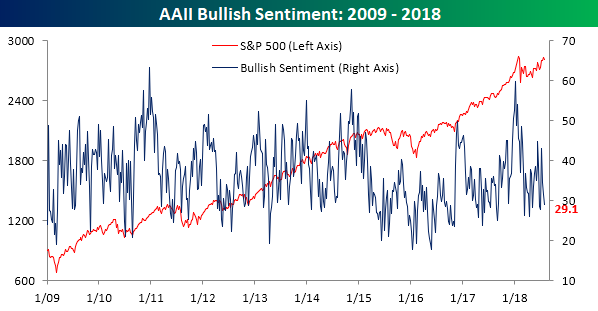
Between Facebook’s (FB) record plunge last week and some other high profile weakness in former leading stocks, we would have thought that individual investor sentiment would have taken a big turn for the worse this week. While bullish sentiment did decline, the drop was smaller than we were expecting. According to the weekly sentiment survey from the American Association of Individual Investors (AAII), bullish sentiment dropped from 31.52% down to 29.11%, which is actually smaller than the declines we saw in each of the prior two weeks when equities were doing better!
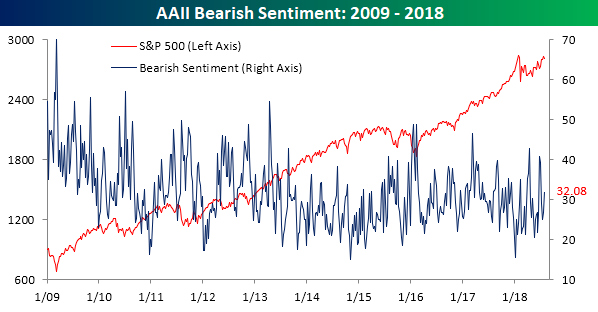
Although bullish sentiment saw just a small decline, bearish sentiment saw its largest one-week increase since the end of June, rising from 26.9% up to 32.1%. Still, that’s hardly a level that indicates much in the way of worry.
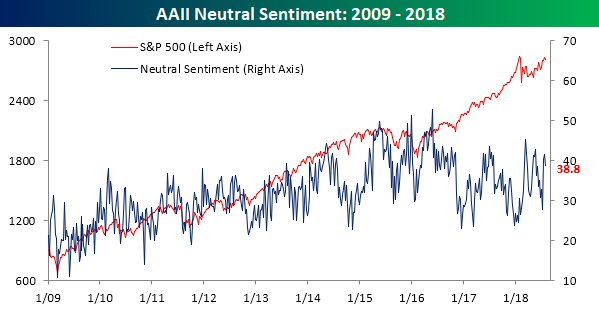
Most of this week’s new bears came from off the fence, as neutral sentiment declined from 41.58% down to 38.81%.
Bespoke Consumer Pulse Report — July 2018
Bespoke’s Consumer Pulse Report is an analysis of a huge consumer survey that we run each month. Our goal with this survey is to track trends across the economic and financial landscape in the US. Using the results from our proprietary monthly survey, we dissect and analyze all of the data and publish the Consumer Pulse Report, which we sell access to on a subscription basis. Sign up for a 30-day free trial to our Bespoke Consumer Pulse subscription service. With a trial, you’ll get coverage of consumer electronics, social media, streaming media, retail, autos, and much more. The report also has numerous proprietary US economic data points that are extremely timely and useful for investors.
We’ve just released our most recent monthly report to Pulse subscribers, and it’s definitely worth the read if you’re curious about the health of the consumer in year two of Trump’s economy. Start a 30-day free trial for a full breakdown of all of our proprietary Pulse economic indicators.

Jobless Claims Making New Records
Jobless claims came in lower than expected this week with the seasonally adjusted headline reading rising by 1K to 218K compared to consensus forecasts of 220K. While it wasn’t a big ‘beat’ relative to expectations, let’s just put the string of recent low readings into perspective. This week was the 178th straight week of sub 300K claims (a record), the 43rd straight week at or below 250K (longest streak since 1970), and the fourth straight week of readings at or below 220K (longest streak since 1969).
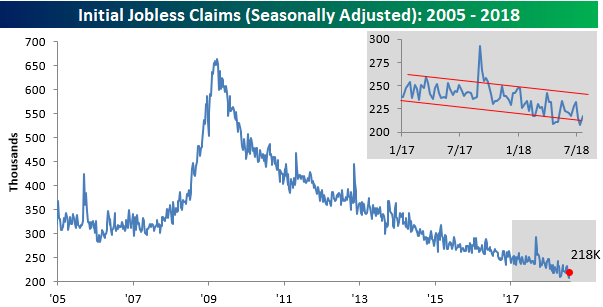
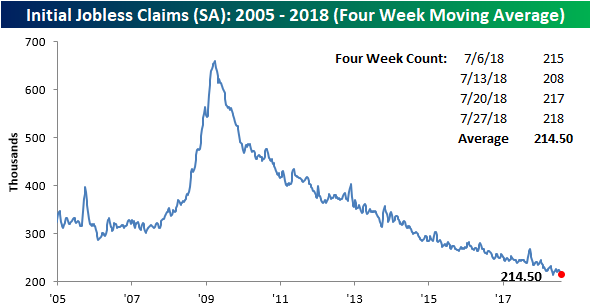
This week’s low reading in claims brought the four-week moving average close to a new cycle low this week as well. At 214.5k, the average is now within just 1K of a new cycle low. However, in order to break that prior low from May, we would need to see a reading next week below 211K (assuming no revisions). It’s possible, but it will be tough.
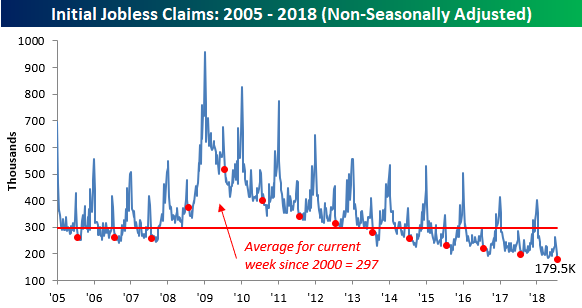
Finally, the non-seasonally adjusted (NSA) reading of claims also declined this week to its lowest level for the month of July on record. At 179.5K, it’s also over 117K below the average of 297K for the current week of the year dating back to 2000.
the Bespoke 50 — 8/2/18
Every Thursday, Bespoke publishes its “Bespoke 50” list of top growth stocks in the Russell 3,000. Our “Bespoke 50” portfolio is made up of the 50 stocks that fit a proprietary growth screen that we created a number of years ago. Since inception in early 2012, the “Bespoke 50” has beaten the S&P 500 by 91.5 percentage points. Through today, the “Bespoke 50” is up 196.0% since inception versus the S&P 500’s gain of 104.5%. Always remember, though, that past performance is no guarantee of future returns.
To view our “Bespoke 50” list of top growth stocks, click the button below and start a trial to either Bespoke Premium or Bespoke Institutional.
