Monster JOLTS
Today’s Job Openings and Labor Turnover Survey from the BLS came in significantly stronger than expected as the number of job openings came in at 6.939 million versus estimates for a level of 6.675 million. Based on this report and reports over the last few months, 2018 is shaping up as a year where economists have underestimated the strength of the US job market. To illustrate, in the each of the JOLTS reports covering 2018 so far, all seven of them have come in better than expected, beating expectations by an average of 219K!
In the chart below, we update the spread between the number of Job openings in the US to the number of unemployed. You may recall that back in March the number of job openings exceeded the number of unemployed for the first time since the data for the JOLTS survey begins in 2001. Since then, the gap between job openings and available workers has continued to widen. Through July, which is the most recent available data for the JOLTS survey, the gap stood at a record 659K.
Earlier on Tuesday, the NFIB Small Business Optimism Index showed that small businesses are increasingly having trouble finding available workers and the latest data from the JOLTS survey confirm the tightness of the US labor market. These days, available jobs are like shooting fish in a barrel.

Bespoke Stock Scores — 9/11/18
Gauging US Versus Eurozone Employment
Today the Eurostat updated its quarterly measurement of employment in the Eurozone. As shown in the chart below, Eurozone payrolls expanded less than the US for three quarters running, after three quarters of Eurozone employment outstripping the US. Both economies are growing employment at a pretty similar and strong pace, in the mid-1% annualized range. Most of the current global cycle has seen the US grow employment faster than the Eurozone, but of course the US saw employment contract faster than the Eurozone during the global financial crisis.
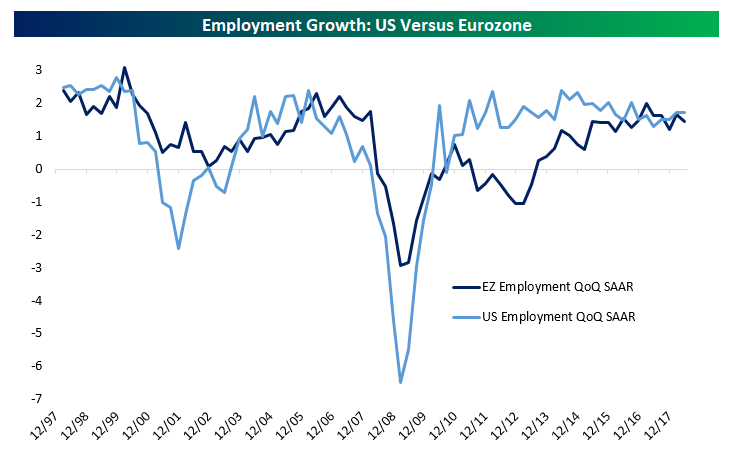
Since the first quarter of 2008, when both Eurozone and US employment peaked (chart below), there have been multiple large swings in employment in the world’s two largest economies. In the US, employment dropped 6.2% from the pre-crisis peak through Q1 of 2010. The Eurozone drop (-3.6% from peak) was much less dramatic, but it took further to get there (Q2 2013 bottom). Since bottoming, US payrolls have surged 7.5% relative to their Q1 2008 peak, while Eurozone payrolls have advanced 2.4% versus the prior peak.
Chart of the Day: What FX Has To Say About Stocks
“Business is Booming”
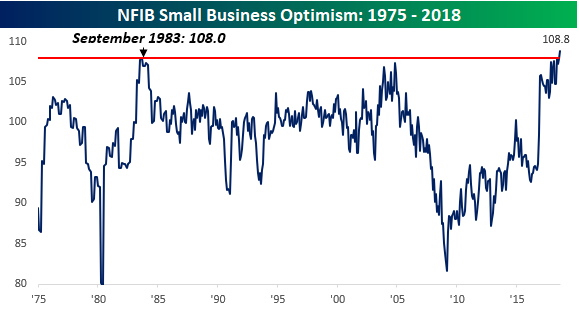
“Business is booming.” That statement was taken from the commentary section of the August NFIB report on small business optimism. In fact, business appears to be so strong for US small businesses that the index of Small Business Optimism rose to a record high of 108.8 in August. That surpassed the old record of 108.0 back in September 1983. While the record high in 1983 came just three years after small business sentiment in the US hit a record low, the current record high comes ten years after sentiment hit a generational low.
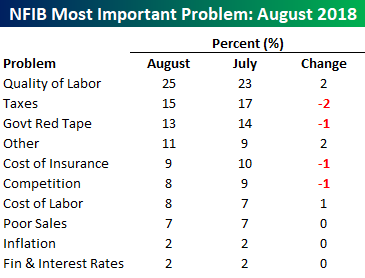
One of the trends that stood out in this morning’s release was that 89% of small business owners looking to hire have found either no or few qualified applicants, indicating a pretty significant skills gap in the US economy. Given the lack of available qualified labor, a record 25% of small businesses cited Quality of Labor as the number one problem they face.

Of all the various ‘problems’ small businesses face, Quality of Labor is the biggest. It wasn’t that long ago that issues like Taxes and Red Tape were the biggest issues, but they have now taken a backseat, and even after combining the two issues, they are only a slightly bigger (28%) problem than labor quality. Finally, while investors have been very concerned with upward price pressures this year, small businesses owners seem complacent with just two percent citing inflation as their number one problem.
The Closer — Backwardation, Earnings, Real Rates, European Data — 9/10/18
Log-in here if you’re a member with access to the Closer.
Looking for deeper insight on markets? In tonight’s Closer sent to Bespoke Institutional clients, we review crude markets, earnings forecasts, and real rates. We also review economic data from the UK and Sweden.

See today’s post-market Closer and everything else Bespoke publishes by starting a 14-day free trial to Bespoke Institutional today!
B.I.G. Tips — Nasdaq 100 (QQQ), S&P 500 (SPY) Testing Key Support
Emerging Markets in Bear Market Territory
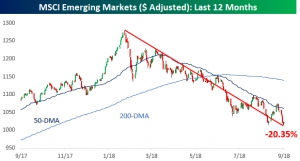
Things have been so bad for emerging market equities of late that the MSCI Emerging Market index has now declined over 20% from its January high on both an intraday and closing basis. That officially puts the index in bear market territory.
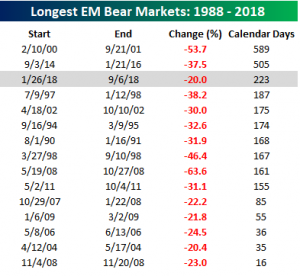
What’s particularly noteworthy about the current bear market for EM is that even though it is far from the most severe of the last 30 years, it already ranks as the third longest. The only longer declines of 20% or more in the index (without a 20% rally) were from February 2000 through September 2001 (589 days) and September 2014 through January 2016 (505 days).
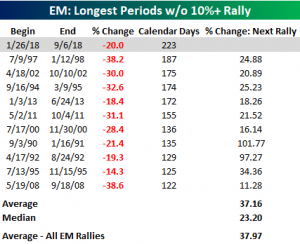
Even more significant, in our view, is the fact that the current downturn in EM is also the longest stretch without a 10%+ rally (223 days) in over 30 years. Going back to 1988, there has never been another period where EM went more than six months without a 10% rally. Looking ahead, when EM finally did turn, the average rally was just over 37%, which is right inline with the historical average.
In today’s Chart of the Day for Bespoke members, we looked at the huge performance gap between the US equity market and emerging markets so far in 2018 and whether or not it can last. Start a two-week free trial to any membership level to give it a read.
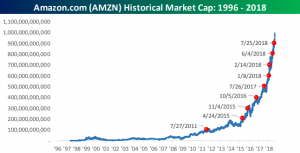
Amazon Surpasses $1 Trillion
Of the five FAANG stocks, Amazon.com (AMZN) made positive headlines last week as its market cap briefly breached the trillion level intraday Tuesday before pulling back. Since the stock didn’t finish the day with a market cap above that level, it wasn’t official, but for a brief moment, the two AAs of FAANG were both members of the trillion dollar club.
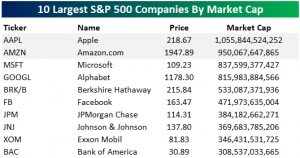
Looking at the ten largest S&P 500 companies by market cap, behind AAPL and AMZN, the only two stocks anywhere close to the trillion level are Microsoft (MSFT) and Alphabet (GOOGL), and when we say close, they still have to rally about 20% to get there.
The next two largest companies — Berkshire and Facebook — would essentially have to double from here, while the remaining four stocks in the top ten would basically have to triple.
Amazon’s road to a trillion has been extraordinary. It took AMZN 5,186 days as a public company to first cross the $100 billion mark, but only 41 days to go from $900 billion to $1 trillion (on an intraday basis). Since first crossing the $200 billion threshold in April 2015, AMZN has added $100 billion in market cap at an average of once every six months. Talk about a money machine!
Equifax – One Year Later
This past Friday (Sept. 7th) marked the one year anniversary of the Equifax (EFX) data breach announcement. The breach, which exposed 143 million Americans’ personal information, sent EFX plummeting 37.23% from $142.72 to a low of $89.59 one week later.
As you can see from the chart below, EFX has been steadily recovering since the lows made in the immediate aftermath of the breach announcement. At the close on Friday, EFX was sitting at a 52-week high of $135.91, only 5.13% from its level before the data breach was announced and 7.55% from its all time high. After the breach was announced, many wondered how EFX could ever recover, but at this point just one year later, it’s been all but forgotten by investors.
