The Closer – Revenge on the Shorts, Nasdaq YTD Gains, Commodities Market Cycles – 8/8/18
Log-in here if you’re a member with access to the Closer.
As shown below, the most shorted stocks by investors are also the stocks least loved by Wall Street analysts. The least shorted stocks are the ones most loved by analysts.
In tonight’s Closer sent to Bespoke Institutional clients, we look at the relationship between short interest and analyst ratings, provide a mid-week earnings season update, and we look at the fledgling CRB commodities bull market.

See today’s post-market Closer and everything else Bespoke publishes by starting a 14-day free trial to Bespoke Institutional today!
Back When Things Happened In August
Financial markets today look just how you would expect them to look on a hot sunny day in August. There’s not a lot going on. Take economic data, for example. We’re already three days into the trading week and the only reports of note so far have been JOLTs (which really isn’t really a market-moving report) and Consumer Credit. While the slowness of today feels normal, there was actually a time when things happened in August. A case in point? 2011.
Seven years ago today, financial markets opened the week sharply lower. The culprit behind the weakness was Standard and Poor’s downgrade of the USA’s sovereign credit rating from AAA to AA, ending a run of seventy years with the highest rating. The rationale for the downgrade was the rating agency’s reduced confidence in the government’s ability to manage its finances. If you don’t recall, leading up to that downgrade, Washington was embroiled in a showdown over the debt ceiling. The GOP claimed that it wanted spending cuts to accompany any increase in the amount of debt the US was authorized to issue, while Democrats claimed Republicans were playing politics and wanted an increase in the debt ceiling with no strings attached (as prior increases had been confronted in years past). It came right down to the wire, but at the end of July 2011, Congress reached a deal two days before the US would have been forced to default on some of its obligations. While the issue was resolved, financial markets were in turmoil all throughout the final days of negotiations, leading up to the debt downgrade, as well as after.

The downgrade actually came on the Friday before August 8th, when S&P issued a release after the close of trading on August 5th. It’s not only companies that wait until Fridays when everyone is out of the office to release bad news! Immediately after the downgrade, S&P received widespread criticism and was accused of playing politics. Who were they to suddenly question the ability of the US government to repay its debts when they had missed the biggest credit bubble in history just three years earlier? Critics argued that while Standard and Poor’s had no issue slapping AAA ratings on subprime CDOs during the housing bubble, now they questioned the ability of the US, which has a printing press at its disposal, to make good on its debts! Within a month of the downgrade, the President of S&P stepped down after the Treasury and Obama Administration questioned the methodology S&P used in their assumptions.
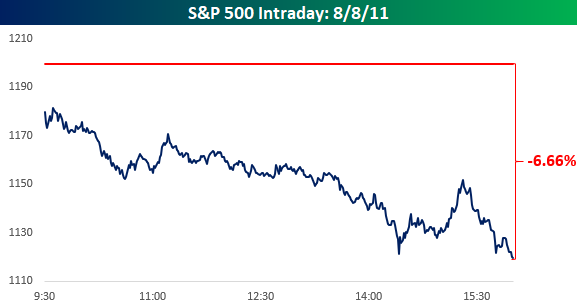
Monday, August 8th was plain and simple a bad day for US equities right from the start. At the open, the S&P 500 was already down 1.6%. Two minutes after the open, it was already down over 2%. By 10:30, it was down 3%. By noon, we were down close to 4% and still declining. Shortly after 2 PM, bulls tried to make a stand, but it didn’t last, and at 4 PM, the S&P 500 finished at its lows of the day with an ominous decline of 6.66%. How’s that for a start to the week.
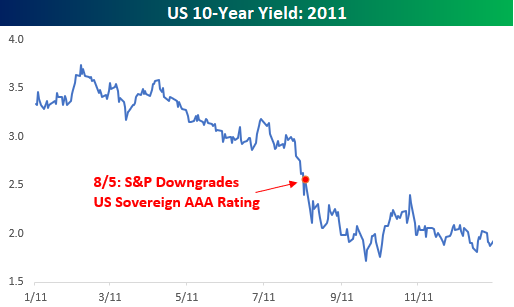
All around financial markets, there were big moves. Strange enough as it sounds, treasuries actually rallied that day with the 10-year yield falling 24 basis points to 2.32%. From there, it continued to decline right through September as it dropped below 2%. Believe it or not, the yield on the 10-year was actually higher in the first half of 2011 than it is now, and at one point was above 3.5%.
The dollar also caught a bid in the days after the downgrade and by the end of September was near its highs of the year. Movements like we saw in treasuries and the dollar after the US debt downgrade prove the ever important fact that when it comes to financial markets, nothing is certain except the past.

Since the close on 8/8/11, the S&P 500 is up 138%, while the average return of stocks that are currently in the index since then is a gain of over 200%! During that time, five stocks are up over 1,000%, and none of them are Netflix (it’s ‘only’ up 970%)! A total of 37 stocks are up over 500%, while two-thirds of the stocks in the index have at least doubled. At the same time, just 27 stocks in the index are down. Think about it this way; after the close of trading on 8/8/11, if you picked any stock at random, you would have been more likely to pick a five-bagger (500%+ gain) than a stock that went down. Even more amazing is that you would have been ten times more likely to pick a stock that would double as opposed to one which would have lost money.
As bad as the market felt that day, in retrospect, it was a great buying opportunity. The big question investors have to answer for themselves today is that seven years from now if we look back on today, will we be able to say the same thing?

Trend Analysis of US Stocks and ETFs
Our Trend Analyzer tool allows investors to easily monitor directional trends and overbought/oversold levels for a large basket of stocks or ETFs. This fully interactive tool is only accessible for paid Bespoke subscribers, but below we’ve taken some snapshots of the tool in action so you can 1) see what it looks like and 2) glean some market insights. Note that subscribers with access are able to build custom Trend Analyzer portfolios of just the stocks and ETFs that they want to see. It’s a great way to monitor your portfolios and watch lists!
If you’d like to read about how our proprietary Trend and Timing scores are calculated, please scroll to the bottom of our Trend Analyzer page.
The main thing to point out in our first snapshot is that all but two of the major US index ETFs that we track are now in “overbought” territory, while the two that aren’t are neutral. These two neutral ETFs are both small-cap related — the Russell 2,000 (IWM) has just moved back above its 50-day moving average, while the micro cap ETF (IWC) is the only one below its 50-day.
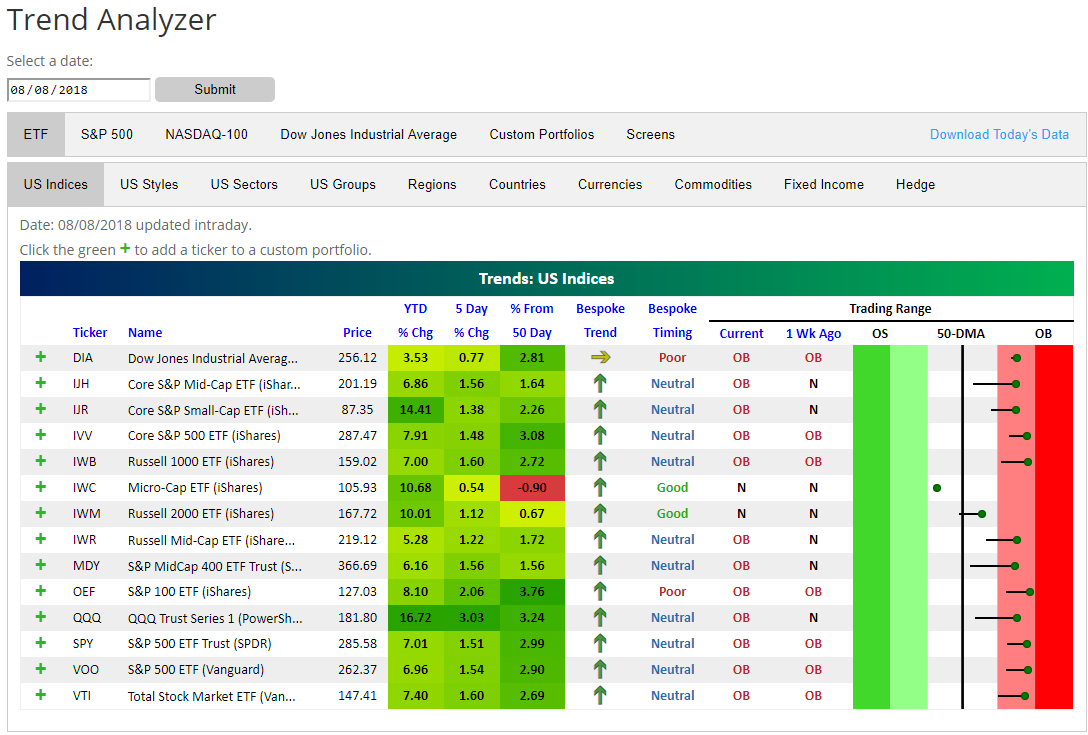
For US sector ETFs, you can see that every single sector is now back above its 50-day moving average, and all but two are trading at “overbought” levels. Materials (XLB) and Energy (XLE) are the only two sectors that aren’t currently overbought.

Below we move away from ETFs and focus on individual stocks. The snapshot below shows the Nasdaq 100 stocks that are currently the most overbought (most extended above their 50-day moving average in terms of standard deviations). When a stock is trading in the dark red zone, it’s more than two standard deviations above its 50-DMA. There are eight stocks in the Nasdaq 100 that are more than two standard deviations above their 50-DMAs, with T-Mobile (TMUS) the most overbought followed closely by Cerner (CERN), and Apple (AAPL). Tesla (TSLA) is now the fifth most overbought stock in the Nasdaq 100 after CEO Elon Musk tweeted yesterday that he’s considering taking the company private at $420/share.

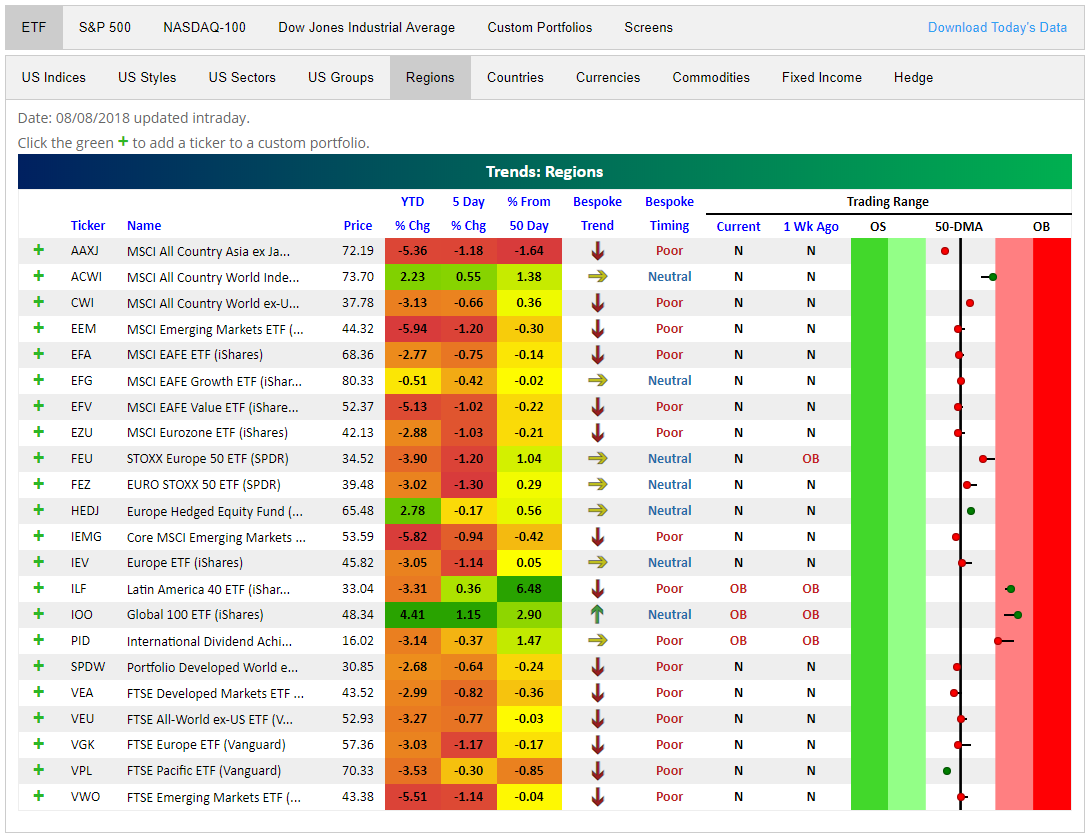
Moving away from the US stock market, below we show regional stock market ETFs from around the world.
Here you can see that things don’t look nearly as bullish. Every ETF shown that has no US exposure is down over the last week, and nearly all of them are in the red year-to-date as well. Note that none are oversold, though. They’re mostly just trading right in neutral territory near their 50-day moving averages.
Click here to try the Trend Analyzer for yourself! If you start a free trial to Bespoke Premium, you can even set up your own custom portfolios.
The Closer — “I Think I Can. I Think I Can.”
Log-in here if you’re a member with access to the Closer.
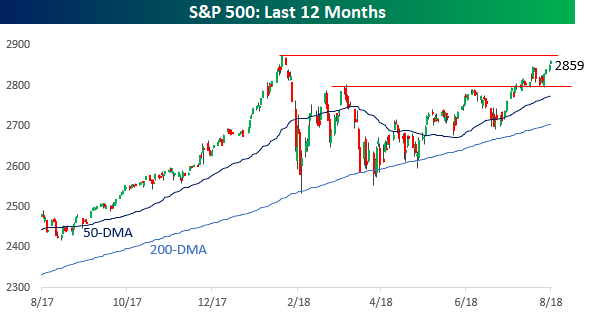
This big stock market engine that could is doing its best to climb the hill and get over the hump as the S&P 500 traded within 0.5% of its all-time high today. The end of the correction is nearly confirmed, but don’t get impatient here. Remember that the S&P 500 has been up for four days in a row and even had a bit of a problem trading and staying above 2,860 on Tuesday.
Looking for deeper insight on what to expect from the market if the S&P 500 takes out the January highs? In tonight’s Closer sent to Bespoke Institutional clients, we included a complete analysis of how the S&P 500 has performed following the end of similar droughts.
See today’s post-market Closer and everything else Bespoke publishes by starting a 14-day free trial to Bespoke Institutional today!
These Four Stocks Went From $325 Billion to $3.5 Trillion in Less Than 10 Years
With Apple (AAPL) crossing the $1 trillion market cap level last week, below is a chart showing the historical market caps for the four largest S&P 500 stocks at the moment. What an incredible run these four stocks have had over the last ten years!
At the Financial Crisis lows in March 2009, these four stocks had a combined market cap of just $325 billion. Now they combine to make up $3.5 trillion in market cap — more than 10x their total less than ten years ago. At the depths of despair in early 2009, investors were fleeing stocks when they should have been “buying low.” Shoulda, woulda, coulda!
With Apple (AAPL) at a trillion now and Amazon, Alphabet, and Microsoft all getting close to a trillion, we can only wonder what the next ten years have in store. Looking at the chart, we certainly wouldn’t argue that now is the time to “buy low”! Putting on your “futurist” caps for a moment, if you had to choose, which will be the largest of the four ten years from now, and which will be the smallest?
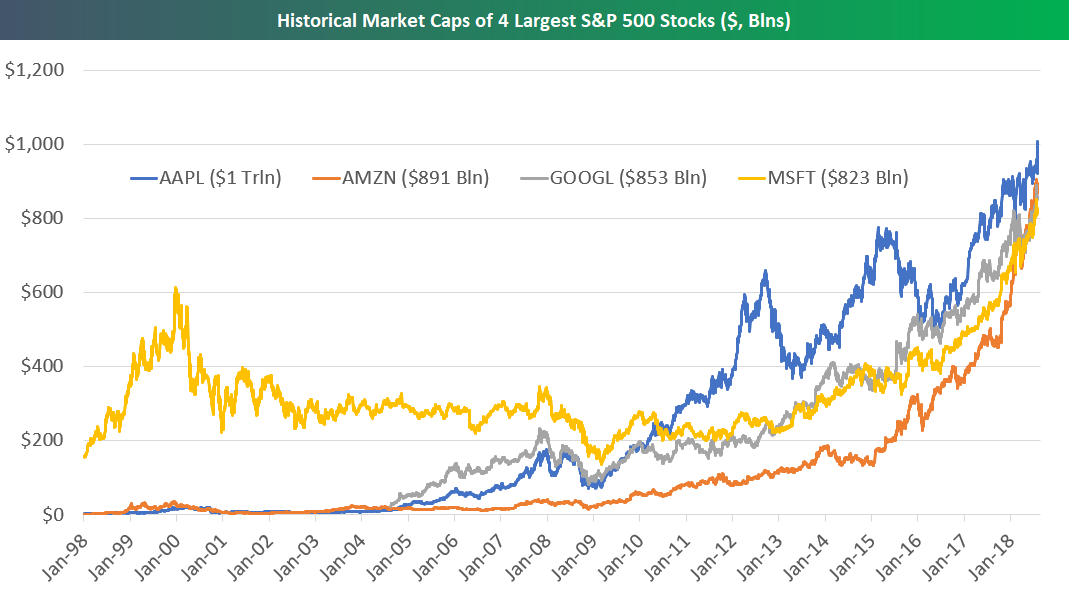
Chart of the Day: The Incredible Shrinking Dow
2018 Asset Class Performance; S&P 500 Total Return New Highs
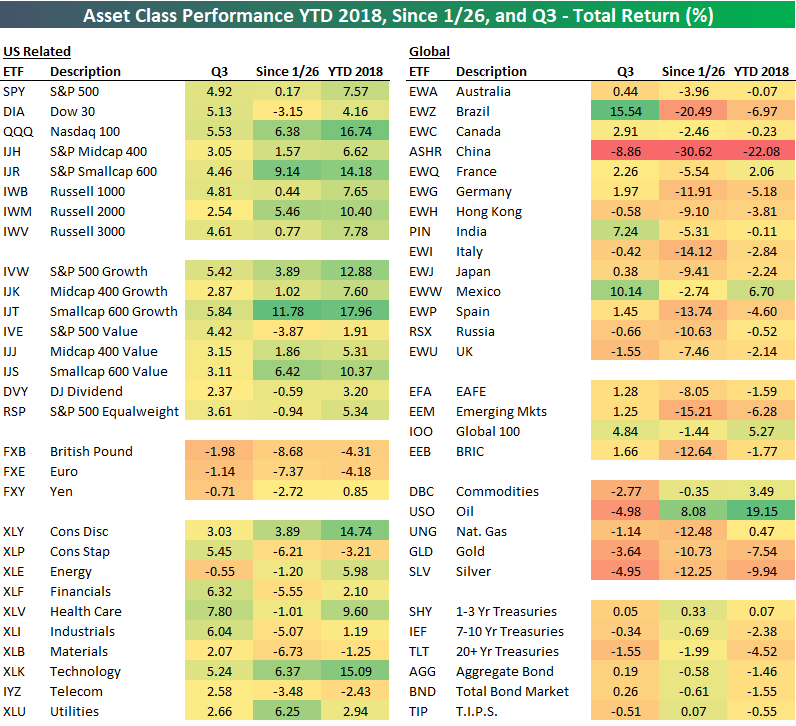
While the S&P 500 is set to open just a stone’s throw away from its January 26th all-time closing high this morning, it’s worth pointing out that the S&P 500 Total Return index (which includes dividends) has already made a new all-time high. We expect that the regular S&P 500 price index will soon follow.

Below is a look at total returns for various asset classes over three time frames — YTD, since the January 26th all-time high for the S&P 500, and in Q3. We’ll focus specifically on total returns since the January 26th all time high since the S&P is now less than 1% away from it.
As noted above, on a total return basis, SPY is already at new highs and is up 0.17% since January 26th. But while SPY is up, the Dow 30 (DIA) is still down 3.15% since 1/26.
So what has been leading and lagging the market since late January? On the leading side, small caps, growth, Consumer Discretionary, Technology, and Utilities are all up big. On the lagging side, we’ve seen weakness for value, Consumer Staples, Financials, Industrials, and Materials.
Outside of the US, things haven’t been very pretty. US investors that have owned country ETFs since late January are pretty deep in the red on these positions. As shown, Brazil (EWZ) and China (ASHR) are both down more than 20% (China is down 30%!), while Germany (EWG), Italy (EWI), Spain (EWP), and Russia (RSX) are all down more than 10%. The emerging markets ETF (EEM) is down 15.21% since 1/26, while the BRIC ETF (EEB) is down 12.6%.
Looking at commodities, oil (USO) is the only one that’s up since 1/26, while gold (GLD), silver (SLV), and natural gas (UNG) are all down more than 10%. Fixed income markets are down slightly as well.
Start a Bespoke Premium free trial for more asset class analysis.
The Closer — Closer and Closer
Log-in here if you’re a member with access to the Closer.
Looking for deeper insight on markets? In tonight’s Closer sent to Bespoke Institutional clients, we judge the likelihood that the S&P 500 goes on to make a new high in the coming weeks given how close it is to its prior all-time highs from late January. We also provide some bullish trading stats for stocks that have reported earnings this season.
See today’s post-market Closer and everything else Bespoke publishes by starting a 14-day free trial to Bespoke Institutional today!