Jobless Claims in Full 1969 Mode
Jobless claims continued to amaze this week coming in at a level of 203K versus consensus expectations of 213K. At this level, first time claims haven’t been lower since December 1969. This week’s report also marks a record 183 straight weeks where claims have come in at or below 300K, the 48th straight week where claims have been at or below 250K (longest streak since January 1970), and the 9th straight week where claims have come in at or below 225K (longest streak since 1969). As shown in the chart below, we’re now coming extremely close to the point where we may have to adjust the Y-axis lower.

With this week’s 203K print, the four-week moving average also posted a new cycle low of 209.5K- a level that hasn’t been seen since 1969.

On a non-seasonally adjusted (NSA) basis, claims fell to 172.4K. That’s the lowest level for the current week of the year dating all the way back to 1969 and more than 100K below the average of 283.4K for the current week of the year dating back to 2000.

Global Markets in the Red
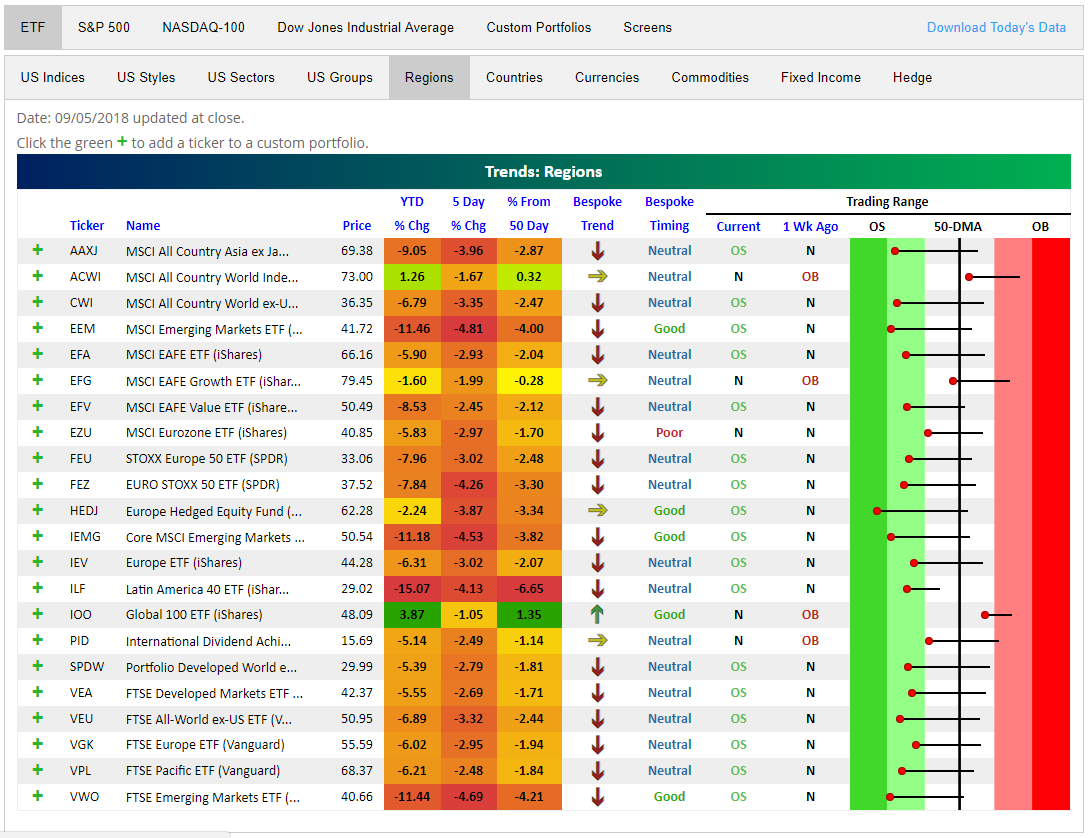
It has been a rough week for global equity markets. Below is a snapshot of recent action across regional equity ETFs using our popular Trend Analyzer tool. The Trend Analyzer is available to Bespoke Premium and Bespoke Institutional subscribers.
There is red shading all over in the snapshot, indicating weakness both on a near-term and longer-term basis. Last week at this time, most of these regional plays had recovered above their 50-day moving averages, but a sharp sell-off since last Wednesday has left just two ETFs above their 50-DMAs. These two ETFs are the only ones that include US equity exposure.
After 3-4% declines over the last week, almost every ETF is now back in oversold territory, with many at extreme oversold levels (dark green shading). From a longer-term perspective, you can also see that our proprietary Bespoke Trend ratings shows downtrends nearly across the board. On both an absolute and relative (to the US) basis, the year just keeps getting worse for international equity markets.
You can learn more about our proprietary Bespoke Trend and Bespoke Timing rating system at the bottom of our Trend Analyzer page.
B.I.G. Tips – US Economic Indicator Diffusion Index Loses Steam
The Closer — Decile, Trade, Canada — 9/5/18
Log-in here if you’re a member with access to the Closer.
Looking for deeper insight on markets? In tonight’s Closer sent to Bespoke Institutional clients, we take a long look at Canada, including both recent analysis of the BoC decision today and USDCAD, as well as a longer term look in terms of productivity and trade data releases from this morning. The Us also had trade data, and we start the note with a decile analysis using some non-traditional metrics for what’s been driving the US stock gain in 2018.

See today’s post-market Closer and everything else Bespoke publishes by starting a 14-day free trial to Bespoke Institutional today!
FAANG Stocks Get Hit
Fixed Income Weekly – 9/5/18
Searching for ways to better understand the fixed income space or looking for actionable ideals in this asset class? Bespoke’s Fixed Income Weekly provides an update on rates and credit every Wednesday. We start off with a fresh piece of analysis driven by what’s in the headlines or driving the market in a given week. We then provide charts of how US Treasury futures and rates are trading, before moving on to a summary of recent fixed income ETF performance, short-term interest rates including money market funds, and a trade idea. We summarize changes and recent developments for a variety of yield curves (UST, bund, Eurodollar, US breakeven inflation and Bespoke’s Global Yield Curve) before finishing with a review of recent UST yield curve changes, spread changes for major credit products and international bonds, and 1 year return profiles for a cross section of the fixed income world.
This week we take a look at which parts of the high yield bond market are trading at double-digit yields. It’s a very small and much less distressed corner of the fixed income markets than you might expect!

Our Fixed Income Weekly helps investors stay on top of fixed income markets and gain new perspective on the developments in interest rates. You can sign up for a Bespoke research trial below to see this week’s report and everything else Bespoke publishes free for the next two weeks!
Click here and start a 14-day free trial to Bespoke Institutional to see our newest Fixed Income Weekly now!
Chart of the Day: Cooper-Standard (CPS) Scores Well
Sector Mean Reversion
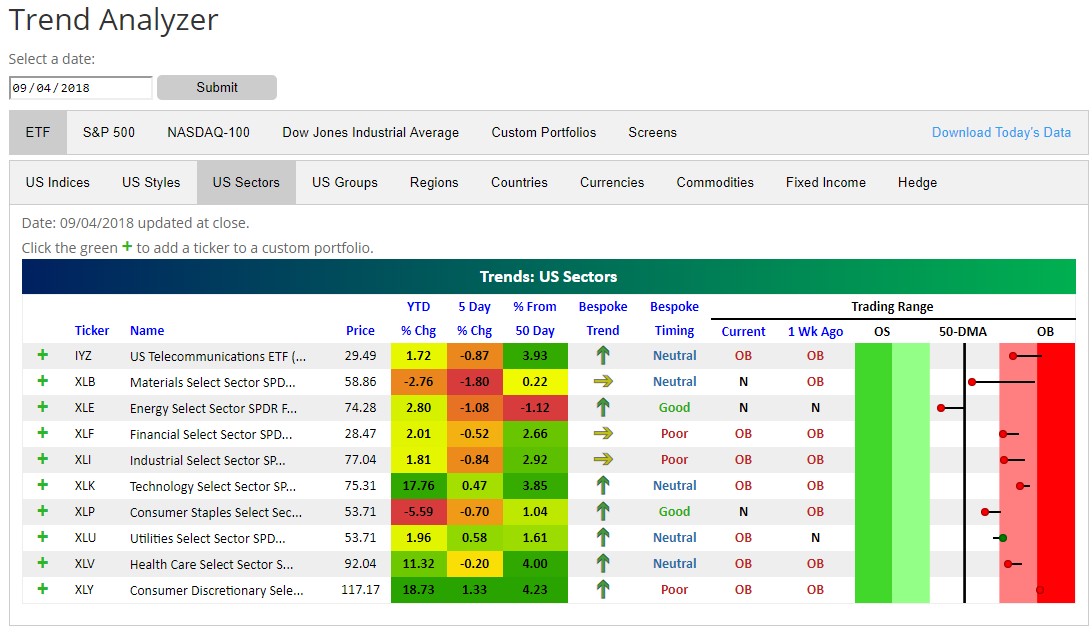
Below is a quick update on S&P 500 sectors using the most popularly traded ETFs on US exchanges. Here we show sectors through our Trend Analyzer tool, which is available to Bespoke Premium and Bespoke Institutional subscribers. We’ve seen some mean reversion over the last week, with seven sectors down and just three up. While all but three sectors remain in overbought territory, every sector except for Utilities has moved lower within its normal trading range.
Materials (XLB) has pulled back the most over the last week with a decline of 1.8%, followed by Energy (XLE) at -1.08%. Consumer Discretionary (XLY), Utilities (XLU), and Technology (XLK) are the three sectors that are up over the last week.
On a year-to-date basis, Consumer Discretionary and Technology are up by far the most with gains of more than 17%. Materials and Consumer Staples are the only two sectors in the red.
Looking at longer-term trends using our proprietary trend algorithm, all sectors are currently either in sideways or uptrends. You can learn more about our proprietary Bespoke Trend and Bespoke Timing rating system at the bottom of our Trend Analyzer page.
Bespoke’s Global Macro Dashboard — 9/5/18
Bespoke’s Global Macro Dashboard is a high-level summary of 22 major economies from around the world. For each country, we provide charts of local equity market prices, relative performance versus global equities, price to earnings ratios, dividend yields, economic growth, unemployment, retail sales and industrial production growth, inflation, money supply, spot FX performance versus the dollar, policy rate, and ten year local government bond yield interest rates. The report is intended as a tool for both reference and idea generation. It’s clients’ first stop for basic background info on how a given economy is performing, and what issues are driving the narrative for that economy. The dashboard helps you get up to speed on and keep track of the basics for the most important economies around the world, informing starting points for further research and risk management. It’s published weekly every Wednesday at the Bespoke Institutional membership level.
You can access our Global Macro Dashboard by starting a 14-day free trial to Bespoke Institutional now!

The Closer — EM Collapse, PMIs Paltry — 9/4/18
Log-in here if you’re a member with access to the Closer.
Looking for deeper insight on markets? In tonight’s Closer sent to Bespoke Institutional clients, we review the ongoing slide in EM assets, including credit and FX. We also review Markit PMI data from around the world and domestic US data released today: auto sales, ISM, and construction spending.
See today’s post-market Closer and everything else Bespoke publishes by starting a 14-day free trial to Bespoke Institutional today!