Chart of the Day: Country “PEG” Ratios
Jobs Day Recap: Wages Impress
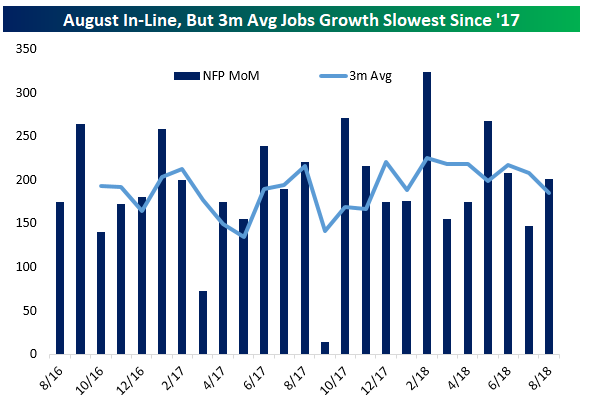
Job creation was slightly stronger than expected by economists in August (+201,000 versus +190,000 expected), but the 3 month average of payrolls growth fell to its lowest level since the end of last year thanks to large downward revisions to June and July data totaling a decline of 50,000 versus what had been previously reported.
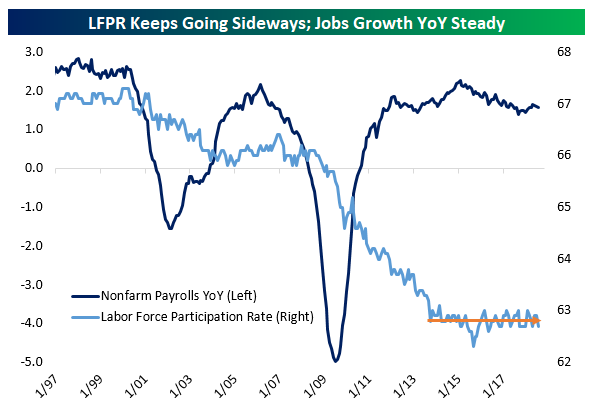
YoY jobs growth is once again slowing after a modest late-expansion uptick which had peaked as-of June. While jobs growth has slowed, it’s still rising at a very healthy pace on an annual basis. Despite ongoing jobs growth, the labor force participation rate has been basically stable for the past 5 years. One reason the LFPR is not rising along with employment is demographics: as the labor force ages, there are large outflows from employment to non-participation thanks to retirement. For instance, on average over the last 12 months, 3% of employed workers have left the labor force entirely. If they had been fired outright, it’s very unlikely they would not start looking for work immediately. Hence, the stability of the LFPR is almost entirely a demographic effect.
Saving the best for last, this was the strongest month of the expansion when it comes to wage growth. Total private wages rose 2.9% YoY, while production & non-supervisory wages (for non-managerial workers) rose to 2.8% YoY, fractional new high on an unrounded basis (+2.80% versus +2.77% in June). While job creation has slowed a bit, wages are continuing their slow process of acceleration after years of extreme weakness post-recession.
The Closer — Thursday Grab Bag — 9/6/18
Log-in here if you’re a member with access to the Closer.
Looking for deeper insight on markets? In tonight’s Closer sent to Bespoke Institutional clients, we cover a wide variety of topics: new highs for gold relative to silver, modestly rising volatility pricing, some strong relative performance in the Italian equity market, what the ADP miss today means for tomorrow’s NFP number, the effects of QE on monetary velocity, weekly EIA data, and recent price action in energy assets.

See today’s post-market Closer and everything else Bespoke publishes by starting a 14-day free trial to Bespoke Institutional today!
Bespoke’s Sector Snapshot — 9/6/18
We’ve just released our weekly Sector Snapshot report (see a sample here) for Bespoke Premium and Bespoke Institutional members. Please log-in here to view the report if you’re already a member. If you’re not yet a subscriber and would like to see the report, please start a two-week free trial to Bespoke Premium now.
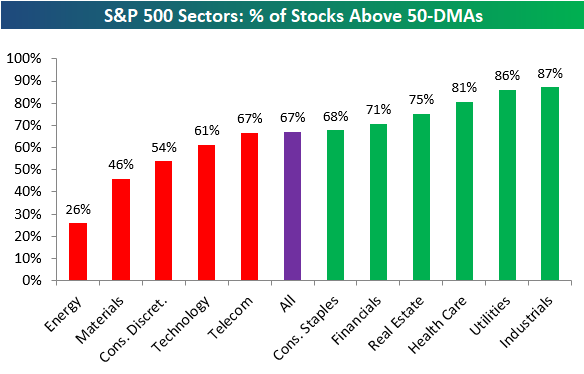
Below is one of the many charts included in this week’s Sector Snapshot, which shows the percentage of stocks in S&P 500 sectors trading above their 50-day moving averages. As shown, 67% of stocks in the broad S&P 500 are above their 50-DMAs, while six of eleven sectors have readings stronger than 67%. Technology and Consumer Discretionary — the two best performing sectors YTD — have weakened a bit and now have lower breadth readings relative to the S&P.
To find out what this means and to see our full Sector Snapshot with additional commentary plus six pages of charts that include analysis of valuations, breadth, technicals, and relative strength, start a two-week free trial to our Bespoke Premium package now. Here’s a breakdown of the products you’ll receive.
Manufacturers’ New Orders
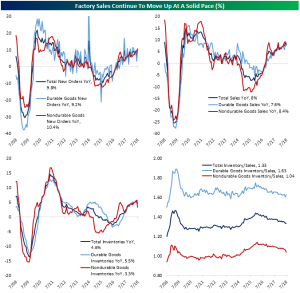
The US Census reported new factory orders that were lower than expected for July with a 0.8% MoM decrease to $497.8 billion. Orders were estimated to fall 0.6% after the 0.7% increase in June. On a year over year basis, new orders are still up 8.3%. Breaking this down, durable goods saw a decline of 1.7% MoM; that large decline follows a 0.9% increase the month before. While not as strong as the previous period, nondurable goods orders rose by 0.2%. These readings are inline with the preliminary release.
Within durable goods, the computers and electronic products industry saw the greatest gain of 0.9% MoM growth in new orders. Machinery was not far behind at +0.8% MoM. These gains were largely helped by mining, oil field, and gas field machinery which increased 13.7% MoM amidst rapid investment in new shale capacity.
The transportation equipment industry dragged down all industries in July. Factory orders excluding transportation equipment were up 0.2% MoM. The volatile transportation equipment industry was down 5.2%, with the largest contributors to this change being nondefense and defense aircraft and parts, which saw 35.4% and 34.4% decreases, respectively. Interestingly though, with the past two periods showing strong gains, defense aircraft orders are actually down 5% YoY versus nondefense aircraft being up 14.1% YoY. The drop in new orders for these two industries completely overshadowed strength in the ships and boats industry which gained 25%.
Shipments were basically unchanged from June to July, up only $0.1 billion, but still up 7.5% YoY. Just like new orders, when the transportation equipment industry is excluded, there was an increase of 0.6% MoM from June to July. While not as drastic as the change in orders, durable goods shipments are down 0.2% MoM. Nondurable shipments are also up 0.2% MoM, mirroring nondurable orders.
Inventories for all manufacturing industry groups grew by 0.8% MoM, down from the 0.2% reading for June. On a year-over-year basis, they are up 5.6%. Once again, nondefense aircraft was a major factor with a 6.7% MoM increase. All manufacturing industries inventories to sales ratio has been relatively flat the past few months. The current ratio sits at 1.35, up 0.1 from June. Nondurable goods remained at the 1.07 level, while durable goods saw a 0.03 increase to 1.63, the same as its May and April number. It is worth noting that both shipments and inventories readings do feed through to GDP calculations by the BEA. Since there were no huge surprises, they should not have a strong impact on Q3 tracking.
Bespoke’s Consumer Pulse Report — August 2018
Bespoke’s Consumer Pulse Report is an analysis of a huge consumer survey that we run each month. Our goal with this survey is to track trends across the economic and financial landscape in the US. Using the results from our proprietary monthly survey, we dissect and analyze all of the data and publish the Consumer Pulse Report, which we sell access to on a subscription basis. Sign up for a 30-day free trial to our Bespoke Consumer Pulse subscription service. With a trial, you’ll get coverage of consumer electronics, social media, streaming media, retail, autos, and much more. The report also has numerous proprietary US economic data points that are extremely timely and useful for investors.
We’ve just released our most recent monthly report to Pulse subscribers, and it’s definitely worth the read if you’re curious about the health of the consumer in year two of Trump’s economy. Start a 30-day free trial for a full breakdown of all of our proprietary Pulse economic indicators.

August Employment Report Preview
Heading into Friday’s Non-Farm Payrolls (NFP) report for August, economists are expecting an increase in payrolls of 194K, which would be an increase from July’s weaker than expected reading of 157K. In the private sector, economists are also expecting an increase of 194K. The unemployment rate is expected to tick down to 3.8% from last month’s reading of 3.9%. Average hourly earnings are expected to grow at a rate of 0.2% versus 0.3% last month, so a stronger than expected reading here may not be greeted positively by the market. Finally, average weekly hours are expected to be unchanged at 34.5

Ahead of the report, we just published our eleven-page preview of the July jobs report. This report contains a ton of analysis related to how the equity market has historically reacted to the monthly jobs report, as well as how secondary employment-related indicators we track looked in July. We also include a breakdown of how the initial reading for July typically comes in relative to expectations and how that ranks versus other months.
One topic we cover in each month’s report is the S&P 500 stocks that do best and worst from the open to close on the day of the employment report based on whether or not the report comes in stronger or weaker than expected. In other words, which stocks should you buy, and which should you avoid? The table below highlights the best-performing stocks in the S&P 500 from the open to close on days when the Non-Farm Payrolls report has been better than expected over the last two years.
Of the top performing stocks on days when NFP beats expectations, eight sectors are represented, but Consumer Discretionary leads the way with eleven. Vornado (VNO) has been the best performing stock with an average open to close gain of 2.72%, but it is followed by six stocks in the Consumer Discretionary sector which have all gained 1%+ from the open to close. Urban Outfitters (URBN), Michael Kors (KORS), and CH Robinson (CHRW) have all been up 90% of the time.
For anyone with more than a passing interest in how equities are impacted by economic data, this report is a must-read. To see the report, sign up for a monthly Bespoke Premium membership now!
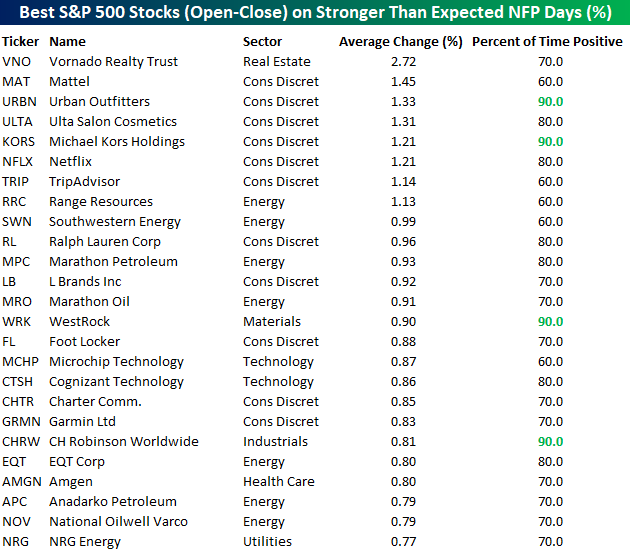
Chart of the Day: SWK Set To Surge?
Strength in the Services Sector
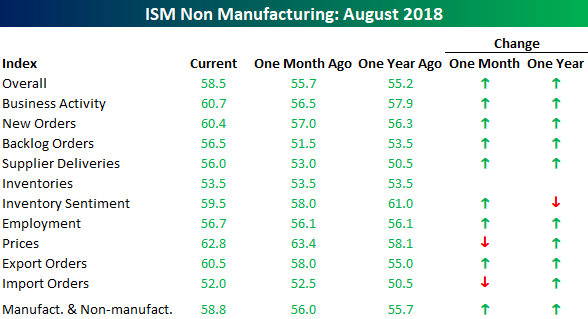
The release of the August ISM Non-Manufacturing report handily exceeded forecasts, coming in at a level of 58.5 versus consensus estimates for a reading of 56.8. The 1.7 point spread between the actual and reported number was also the biggest beat relative to expectations since the January report which was released on 2/5. On a combined basis, accounting for each sector’s share of the overall economy, this month’s Composite ISM came in at a level of 58.8. For perspective, the peak reading in this index for the current period was 59.9 last September.

The table below breaks down this month’s report by each of the index’s subcomponents. On both a m/m and y/y basis, breadth in the report was strong. The only two components that declined sequentially were Price Paid and Import Orders, while Inventory Sentiment was the only decliner relative to the same month last year. The biggest gainers this month relative to July were Backlog Orders, Business Activity, and New Orders.
Bullish Sentiment Remains Elevated
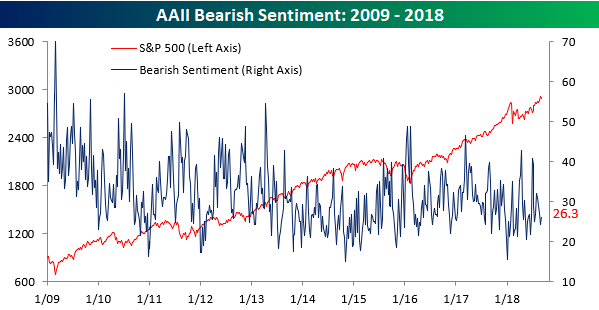
Individual investors continue to be in an optimistic mood, although bullish sentiment did see a slight decline in the latest week. According to the weekly survey from AAII, bullish sentiment dropped from 43.5% down to 42.22%, which is still on the high side of the recent range. It’s also the first back to back weeks where bullish sentiment has been above 40% since February. Given the relative weakness in equities this week, one could argue that it’s a bit of a surprise that bullish sentiment didn’t fall further.
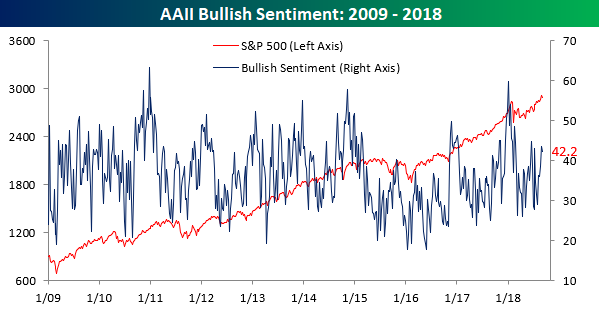
With the slight decline in optimism this week, bearish sentiment ticked slightly higher, rising from 24.39% up to a still relatively low level of 26.3%.