Emerging Markets in Bear Market Territory
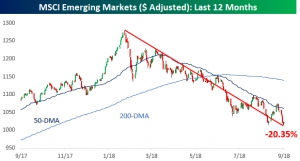
Things have been so bad for emerging market equities of late that the MSCI Emerging Market index has now declined over 20% from its January high on both an intraday and closing basis. That officially puts the index in bear market territory.
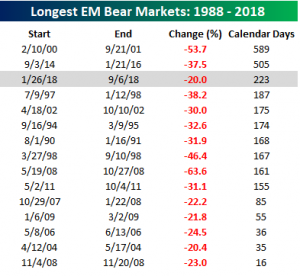
What’s particularly noteworthy about the current bear market for EM is that even though it is far from the most severe of the last 30 years, it already ranks as the third longest. The only longer declines of 20% or more in the index (without a 20% rally) were from February 2000 through September 2001 (589 days) and September 2014 through January 2016 (505 days).
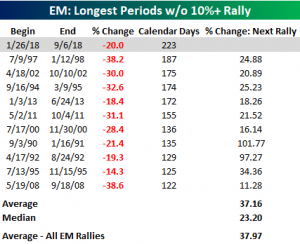
Even more significant, in our view, is the fact that the current downturn in EM is also the longest stretch without a 10%+ rally (223 days) in over 30 years. Going back to 1988, there has never been another period where EM went more than six months without a 10% rally. Looking ahead, when EM finally did turn, the average rally was just over 37%, which is right inline with the historical average.
In today’s Chart of the Day for Bespoke members, we looked at the huge performance gap between the US equity market and emerging markets so far in 2018 and whether or not it can last. Start a two-week free trial to any membership level to give it a read.
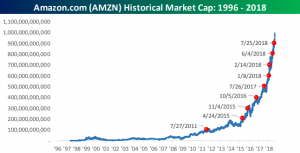
Amazon Surpasses $1 Trillion
Of the five FAANG stocks, Amazon.com (AMZN) made positive headlines last week as its market cap briefly breached the trillion level intraday Tuesday before pulling back. Since the stock didn’t finish the day with a market cap above that level, it wasn’t official, but for a brief moment, the two AAs of FAANG were both members of the trillion dollar club.
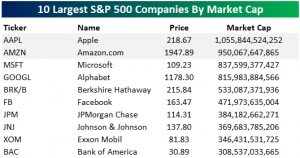
Looking at the ten largest S&P 500 companies by market cap, behind AAPL and AMZN, the only two stocks anywhere close to the trillion level are Microsoft (MSFT) and Alphabet (GOOGL), and when we say close, they still have to rally about 20% to get there.
The next two largest companies — Berkshire and Facebook — would essentially have to double from here, while the remaining four stocks in the top ten would basically have to triple.
Amazon’s road to a trillion has been extraordinary. It took AMZN 5,186 days as a public company to first cross the $100 billion mark, but only 41 days to go from $900 billion to $1 trillion (on an intraday basis). Since first crossing the $200 billion threshold in April 2015, AMZN has added $100 billion in market cap at an average of once every six months. Talk about a money machine!
Equifax – One Year Later
This past Friday (Sept. 7th) marked the one year anniversary of the Equifax (EFX) data breach announcement. The breach, which exposed 143 million Americans’ personal information, sent EFX plummeting 37.23% from $142.72 to a low of $89.59 one week later.
As you can see from the chart below, EFX has been steadily recovering since the lows made in the immediate aftermath of the breach announcement. At the close on Friday, EFX was sitting at a 52-week high of $135.91, only 5.13% from its level before the data breach was announced and 7.55% from its all time high. After the breach was announced, many wondered how EFX could ever recover, but at this point just one year later, it’s been all but forgotten by investors.

Chart of the Day – US vs EM Dichotomy
10 Year Yields Eye A Breakout
Friday’s strong wage numbers catalyzed a significant uptick in yields with 10s rising 6.8 bps to the highest yield since August 8th. One day does not a trend make, but we’ve seen a pretty persistent uptick in yields over the last few weeks. That uptick has been off support that dates back to February. Overhead, there’s been a trend of lower highs since the peak in yields back on May 18th. While yields haven’t broken out of this consolidation yet, they’re certainly moving towards it; a close above either overhead resistance or support below would be a technical signal making a larger move more likely.
Bespoke Brunch Reads: 9/9/18
Welcome to Bespoke Brunch Reads — a linkfest of the favorite things we read over the past week. The links are mostly market related, but there are some other interesting subjects covered as well. We hope you enjoy the food for thought as a supplement to the research we provide you during the week.
Retail
This Space Available by Corey Kilgannon (NYT)
A photographic journal of open retail space around New York City that captures simultaneously the decline of traditional retail and the consequences of soaring lease costs. [Link; soft paywall]
Amazon’s treasure trove of data by Erica Pandey (Axios)
Arguably the most under-valued component of the online giant’s business is its massive trove of data on consumer behavior. [Link]
Football
Runs in the Family by Sarah Spain (ESPN)
The story of an adopted NFL coach and his journey to find his biological parents. [Link]
Healdsburg High Football Team Calls It Quits After Crushing Shutout Losses by Emily Turner (CBS)
A high school team in California suffered two losses so brutal that they decided to disband the team. With only 18 players, the team lost its first two games by a combined score of 102-0, and two of the 18 players quit. [Link; auto-playing video]
Nike’s online sales jumped 31% after company unveiled Kaepernick campaign, data show by Ciara Linnane (MarketWatch)
This week’s decision by Nike to release an advertisement featuring quarterback Colin Kaepernick appears to have been good business thus far, with a 31% increase in sales over the following week (versus a 17% increase the prior year). [Link]
US Dollars
One more reminder that the US dollar is dominant by Colby Smith (FTAV)
While the demise of the dollar as the world’s reserve currency is constantly proclaimed, in reality cross-border funding is overwhelmingly dominated by the greenback and if anything that dominance is growing. [Link; registration required]
Missteps
The Regrets of Lewis Ranieri by Cezary Podkul (WSJ)
A retrospective on the career and contributions (not all positive, mind you) of the man who invented bonds backed by mortgage backed securities in the 1980s. [Link; paywall]
What went wrong at Social Capital by Dan Primack (Axios)
The downfall of what was once the hottest investment vehicle in Silicon Valley appears to have been driven by pure hubris on the part of its founder. [Link]
Social Media
SEC Wants to Keep Tabs on Social Media Posts That Could Move Markets by Aaron Boyd (Nextgov)
In a recent solicitation the SEC has started looking for a tool to monitor social media posts that can have an effect on financial markets. [Link]
Americans are changing their relationship with Facebook by Andrew Perrin (Pew)
New survey data shows over 40% of users have taken breaks from the site for at least several weeks in the past year, suggesting much less intensive use than the relatively recent history. [Link]
Meltdowns
Elon Musk appears to smoke marijuana during an interview by Victor Reklaitis (MarketWatch)
While marijuana may now be legal in numerous states, consequences and stigmas from marijuana use are still in place as Tesla CEO Elon Musk is now discovering after toking up during an interview. [Link]
Italy’s Populists Begin Their Big Betrayal by Ferdinando Giugliano (Bloomberg)
Markets forced some harsh realities onto the populist coalition governing Italy, which has backtracked on anti-euro and anti-austerity rhetoric quickly. [Link; soft paywall]
Read Bespoke’s most actionable market research by starting a two-week free trial today! Get started here.
Have a great Sunday!
2018 Week 1
Outside of financial markets, we’re sports fans here at Bespoke just like most people. With the 2018 NFL season kicking off this weekend, and new legal sports betting avenues now available across the US, we figured we’d have some fun and pick each NFL game versus the spread (as of Saturday evening). Let’s see how we do…
2018 NFL Week 1 Bespoke Picks:
Pittsburgh (-3.5) at Cleveland: Pittsburgh -3.5
Cincinnati at Indianapolis (-2.5): Cincinnati +2.5
Tennessee (-1) at Miami: Tennessee -1
San Francisco at Minnesota (-6.5): Minnesota -6.5
Houston at New England (-6.5): Houston +6.5
Tampa Bay at New Orleans (-9.5): New Orleans -9.5
Jacksonville (-2.5) at NY Giants: NY Giants +2.5
Buffalo at Baltimore (-7.5): Baltimore -7.5
Kansas City at LA Chargers (-3.5): Kansas City +3.5
Seattle at Denver (-3): Seattle +3
Washington (-1.5) at Arizona: Washington -1.5
Dallas at Carolina (-2.5): Carolina -2.5
Chicago at Green Bay (-7): Chicago +7
NY Jets at Detroit (-7.5): NY Jets +7.5
LA Rams (-4.5) at Oakland: LA Rams -4.5
The Bespoke Report — Buyers Strike
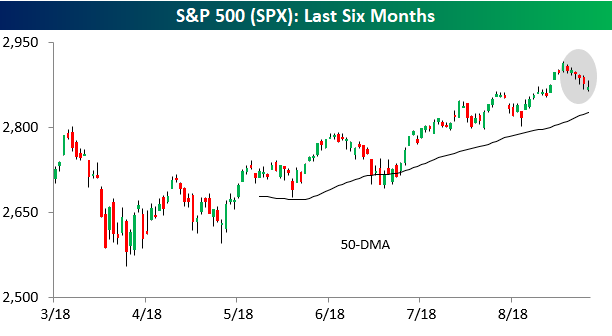
The End of Summer Hangover. The end of Labor Day weekend, when schools are back in session and summer starts to wind down, is always a tough time of year. After a summer of nice weather, swimming, hiking, outdoor sports, and hopefully even a vacation, Tuesday morning after the three-day Labor Day weekend can be rough. This year was no exception, and it was reflected in the performance of US and global equity markets.
Take a look at the chart below. For six straight trading days now, the S&P 500 had a lower intraday high and lower intraday low than the prior day’s levels. That type of consistent selling with zero in the way of buying doesn’t happen very often. To find the most recent occurrence, you have to go all the way back to May 2012, and since 1982, it has only occurred eight other times.
We’ve just published our latest weekly Bespoke Report newsletter, which is available to subscribers across all three of our membership levels. Sign up here to read the report.
To get up to speed on our thoughts regarding the market’s direction going forward, choose any membership option and access this week’s full Bespoke Report newsletter after signing up! You won’t be disappointed. Some of the topics discussed in this week’s report include:
- Buyers Strike
- International/Domestic Dichotomy
- FAANGed Up
- Bear Market in Emerging Markets
- Economic Review
- Years Like 2018
- Back to School Review
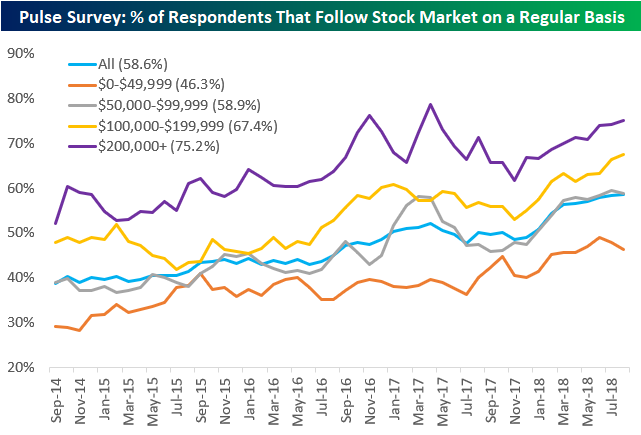
Who’s Following the Stock Market?
One of the questions we ask consumers in our monthly Consumer Pulse survey is if they follow the stock market on a regular basis. Since we began running our Pulse survey in 2014, the percentage of respondents that follow the stock market has steadily ticked higher to its current level of 58.6% (as of August). This is generally to be expected given that the stock market has also steadily ticked higher since 2014, but we really don’t know what would happen during a bear market because we haven’t had a bear market in nine years.
Below is a breakdown of interest in the stock market by annual income bracket. They say that the stock market is only for the wealthy, so let’s see what the numbers show.
The highest income bracket in our survey ($200k+) has had the highest percentage of interest in the stock market every month since we began running our survey in 2014. In the most recent month, 75.2% of consumers with incomes above $200k said they follow the stock market on a regular basis. This is not quite at an all-time high, though, even with the S&P 500 recently trading to new all-time highs. April 2017 is when stock market interest for the highest income bracket hit its highest level in our survey at just over 78%.
As might be expected, the higher the income, the more interest in the stock market. The $100,000-$199,999 bracket has the 2nd highest interest in the stock market at 67.4%, followed by the $50,000-$99,999 bracket at 58.9%. The lowest income bracket ($0-$49,999) has the lowest interest in the stock market, but at 46.3%, nearly a majority of the group says they follow the stock market on a regular basis.
As you can see in the chart, interest in the stock market has picked up across all income brackets over the last four years.
Bespoke’s Consumer Pulse Report is an analysis of a huge consumer survey that we run each month. Our goal with this survey is to track trends across the economic and financial landscape in the US. Using the results from our proprietary monthly survey, we dissect and analyze all of the data and publish the Consumer Pulse Report, which we sell access to on a subscription basis. Sign up for a 30-day free trial to our Bespoke Consumer Pulse subscription service. With a trial, you’ll get coverage of consumer electronics, social media, streaming media, retail, autos, and much more. The report also has numerous proprietary US economic data points that are extremely timely and useful for investors.
We’ve just released our most recent monthly report to Pulse subscribers, and it’s definitely worth the read if you’re curious about the health of the consumer in year two of Trump’s economy. Start a 30-day free trial for a full breakdown of all of our proprietary Pulse economic indicators.