Big Drop in Bullish Sentiment
The post-summer hangover after Labor Day weekend certainly didn’t sit well with individual investors. In this week’s sentiment survey from AAII, bullish sentiment dropped by over 10 percentage points, falling from 42.2% down to 32.1%. That’s the lowest weekly reading in optimism since the beginning of August and the largest weekly decline in bullish sentiment since late June.
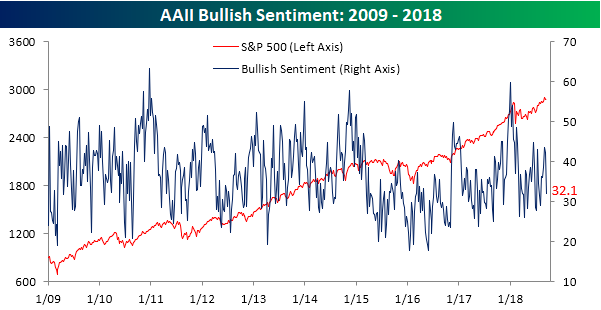
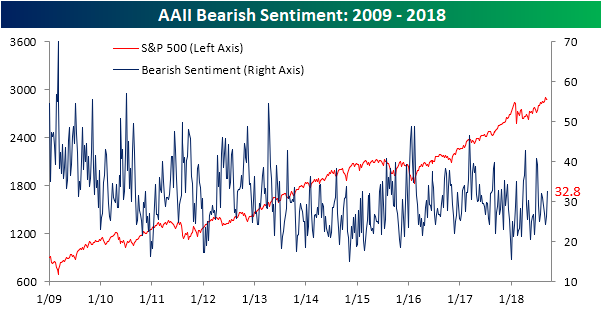
While bullish sentiment plunged, not all of those former bulls went straight into the bearish camp. In fact, it was just about two-thirds as negative sentiment increased from 26.3% up to 32.8%. That increase was still the largest weekly increase since late June and is the first time since the start of August that bears have outnumbered bulls.
the Bespoke 50 — 9/13/18
Every Thursday, Bespoke publishes its “Bespoke 50” list of top growth stocks in the Russell 3,000. Our “Bespoke 50” portfolio is made up of the 50 stocks that fit a proprietary growth screen that we created a number of years ago. Since inception in early 2012, the “Bespoke 50” has beaten the S&P 500 by 110.0 percentage points. Through today, the “Bespoke 50” is up 219.9% since inception versus the S&P 500’s gain of 109.9%. Always remember, though, that past performance is no guarantee of future returns.
To view our “Bespoke 50” list of top growth stocks, click the button below and start a trial to either Bespoke Premium or Bespoke Institutional.

Jobless Claims Stuck in the Sixties
Like an aging hippie that just can’t get with the times, weekly jobless claims remain at levels not seen since the 1960s. This week’s report came in at 204K versus estimates for a reading of 210K and was the lowest weekly print since December 1969. Pretty soon we’re going to have to adjust the Y-axis lower! Weekly claims have now been at or below 300K for a record 184 straight weeks, at or below 250K for 49 straight weeks (longest streak since January 1970), and at or below 225K for ten straight weeks (longest streak since 1969).
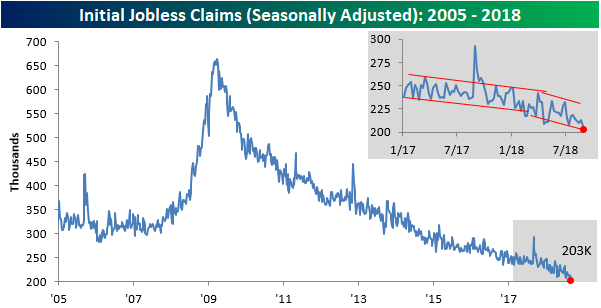
This week’s generational low in weekly claims also dragged the four-week moving average lower by 2K, from 210K down to 208K. That’s also the lowest reading for this indicator since December 1969.

On a non-seasonally adjusted basis (NSA), claims dropped over 10K, falling from 172.4K down to 161.9K. For the current week of the year, that’s the lowest reading since 1969 and it’s more than 125K below the average of 289K for the current week of the year dating back to 2000.

The Closer — Optimistic ASEC — 9/12/18
Log-in here if you’re a member with access to the Closer.
Looking for deeper insight on markets? In tonight’s Closer sent to Bespoke Institutional clients, we review the two best-performing S&P 500 industries year-to-date, the reversal lower in vol markets, and stubborn spreads in high yield. We also delve into the annual update on income distribution, real income growth by demographic, poverty data, and health insurance coverage from the US Census before finishing up with a review of petroleum markets following the release of weekly EIA data on inventories, sources, and uses of petroleum products.

See today’s post-market Closer and everything else Bespoke publishes by starting a 14-day free trial to Bespoke Institutional today!
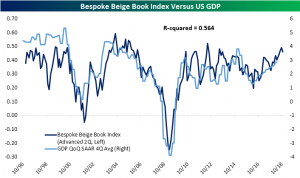
Beige Book Slightly Less Positive, But Showing Strong Growth
The Beige Book was released today with mostly positive findings. Districts generally reported moderate growth across the board. Transportation and manufacturing industries claimed moderate growth, while construction and real estate were slightly less positive. Our Bespoke Beige Book Index is still showing growth, but saw a decrease from the last period. The index is constructed by comparing the prevalence of positive words and negative words in the Beige Book. As shown in the chart below, we show the relationship between GDP and our Beige Book index. On the other hand, trade tensions’ effects on prices alongside a tight labor market seem to be the greatest constraints on the current economy.
A common concern among contacts has been the implications of trade tensions. Many cited tariffs as having an effect on input prices but were unable to pass costs along to customers. This was especially prevalent among manufacturers. Even though they have not been widely felt yet, rising prices are likely looming on the horizon.
The other concern which had widespread impacts was the tight labor market. Firms’ statements in the Beige Book are echoing Tuesday’s NFIB Small Business Optimism Index and JOLTS releases. Firms are having trouble filling roles for both skilled and unskilled labor. To try to fill openings, aside from higher wages, employers have resorted to additional benefits, vacation, and even increased training programs. Despite these efforts, firms just cannot seem to attract enough talent, although we wonder how bad things can be if simple wage hikes aren’t on the table.
Chart of the Day – 11.1
Fixed Income Weekly – 9/12/18
Searching for ways to better understand the fixed income space or looking for actionable ideals in this asset class? Bespoke’s Fixed Income Weekly provides an update on rates and credit every Wednesday. We start off with a fresh piece of analysis driven by what’s in the headlines or driving the market in a given week. We then provide charts of how US Treasury futures and rates are trading, before moving on to a summary of recent fixed income ETF performance, short-term interest rates including money market funds, and a trade idea. We summarize changes and recent developments for a variety of yield curves (UST, bund, Eurodollar, US breakeven inflation and Bespoke’s Global Yield Curve) before finishing with a review of recent UST yield curve changes, spread changes for major credit products and international bonds, and 1 year return profiles for a cross section of the fixed income world.
This week we review whether home prices are likely to slow given the modest increase in mortgage rates we’ve seen this year.

Our Fixed Income Weekly helps investors stay on top of fixed income markets and gain new perspective on the developments in interest rates. You can sign up for a Bespoke research trial below to see this week’s report and everything else Bespoke publishes free for the next two weeks!
Click here and start a 14-day free trial to Bespoke Institutional to see our newest Fixed Income Weekly now!
Canadian Home Prices Get Used To A Slower Roll
The Teranet-National Bank House Price Index of Canadian home prices for August was released this morning. On a national level, the index rose 0.14% MoM at an annual rate; higher, but just barely. August’s YoY growth came in at 1.36%, its lowest level since November 2009. While this may sound bad, the low year over year growth reading is a result of last August’s peak in the index; base effects are now weighing more than high frequency changes.
Of the 11 metropolitan areas that make up the composite, Montreal saw the greatest gains of 10.64% MoM annualized, followed by Hamilton and Ottawa with 9.91% and 8.70%, respectively. Conversely, Vancouver experienced the greatest decline of 4.20%, with Calgary not far behind, down 4.13%.
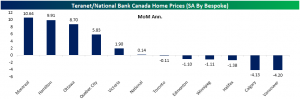
In the past year and a half, Toronto—the largest of the 11 metros—and Hamilton have seen significant declines in YoY growth. The August reading, while still negative, was the first sequential increase in YoY change for the cities since May 2017.
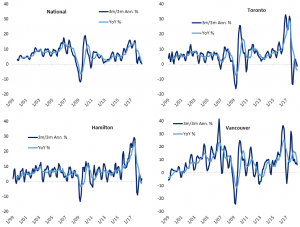
Prices have climbed in Canada for some time now, bringing to question an affordability problem or a housing bubble. The repercussions of rising rates, local policy reforms, and higher lending standards nationally are starting to weigh on home prices. Overall from this report, the Canadian housing market is a mixed bag; not necessarily showing strength or weakness on a national level. While the two largest index contributors, Toronto and Vancouver, have seen modest and great MoM declines, other areas of the country like Montreal—the third largest area—have seen strong growth. Nationally, home prices are clinging to positive territory on both a YoY and 3m/3m annualized rate. While they may avoid declines, it’s pretty clear that the double-digit annual rate of advance we’ve seen in Canada for years is not coming back.
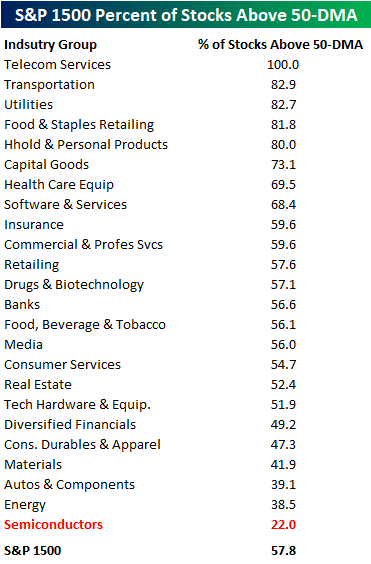
Semiconductors: Bottom of the Barrel
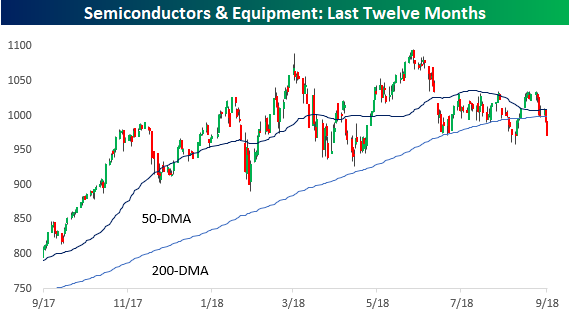
With the broader market (including Technology) at or right near all-time highs, it is pretty surprising just how weak the semis have been. Just yesterday, the S&P 500 Semiconductor and Equipment industry broke back below its 200-DMA, and it is sinking further today following negative comments from Goldman and Stifel.
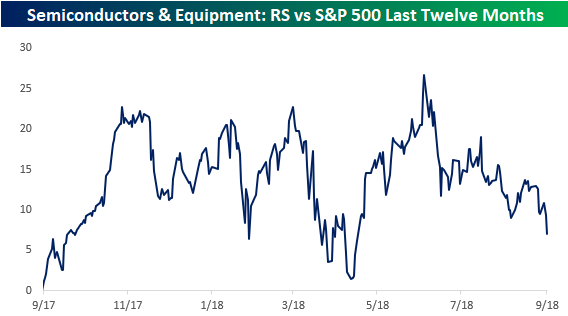
On a relative strength basis versus the S&P 500, the group looks even weaker. Since peaking out in June, the group’s relative strength has been trending sharply lower, and it just made another new short-term low today.
When looking at the various Industry Groups within the S&P 1500 and what percentage of stocks in each one are trading above their 50-DMA, none are currently weaker than the semis. For the S&P 500 as a whole, 57.8% of stocks in the index are above that level. As shown in the table below, with just 22% of stocks in the Semiconductor Industry Group trading above their 50-DMA, no other Industry Group is even close in terms of how few stocks are trading above their 50-DMA. Talk about out of favor!
Bespoke’s Global Macro Dashboard — 9/12/18
Bespoke’s Global Macro Dashboard is a high-level summary of 22 major economies from around the world. For each country, we provide charts of local equity market prices, relative performance versus global equities, price to earnings ratios, dividend yields, economic growth, unemployment, retail sales and industrial production growth, inflation, money supply, spot FX performance versus the dollar, policy rate, and ten year local government bond yield interest rates. The report is intended as a tool for both reference and idea generation. It’s clients’ first stop for basic background info on how a given economy is performing, and what issues are driving the narrative for that economy. The dashboard helps you get up to speed on and keep track of the basics for the most important economies around the world, informing starting points for further research and risk management. It’s published weekly every Wednesday at the Bespoke Institutional membership level.
You can access our Global Macro Dashboard by starting a 14-day free trial to Bespoke Institutional now!
