Fed Speakers Cancel Each Other Out
Recent speeches of FOMC members have leaned very slightly towards dovishness over the last few months, but that doesn’t mean there haven’t been active arguments between hawks and doves! For instance, Atlanta Fed President Bostic (a voter) has tilted more dovish lately, wanting only 1 more hike and no further hikes once the Fed reaches “neutral” (i.e., a rate that won’t either support or hold back economic growth). St. Louis Fed President Bullard has fretted about the yield curve and argued there’s little upside risk to inflation in recent speeches. On the other hand, Governor Brainard argued the Fed needed to think about raising rates above neutral in the longer-run last week, a relatively hawkish perspective given most speakers want to hit neutral and re-assess. Finally, ardent dove Evans of the Chicago Fed (a non-voter) had a speech last week arguing for “normalized” rates, a hawkish sign. At the end of the day, though, all of this discussion has basically been a wash with the Bespoke Fedspeak Monitor index in roughly the same very slightly dovish position over the last few months.
The Bespoke Fedspeak Monitor is only available at the Bespoke Institutional level. Start a two-week free trial for full access.

Empire Manufacturing Report Disappoints
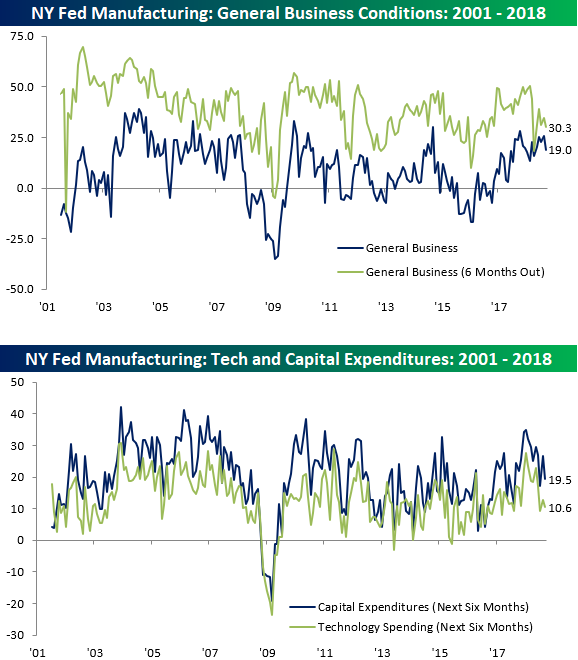
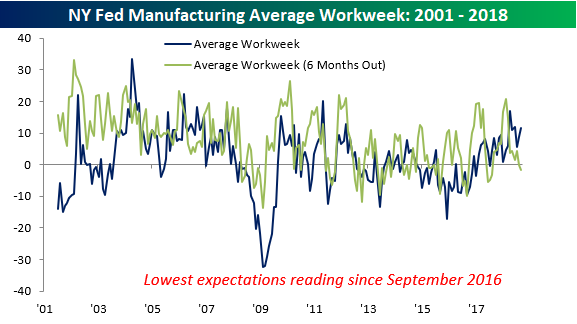
The latest read of the NY Fed Manufacturing report didn’t give such a great preview of economic activity for the month of September. At the headline level, the General Business conditions index dropped from 25.6 down to 19.0 versus expectations for a decline to 23.0. Similar to the current conditions index, the index tracking expectations for six months from now also declined by a similar amount, falling from 34.8 down to 30.3. As shown in the lower chart, plans for Cap Ex and Technology Spending also saw modest declines.
The table below breaks down this month’s report by each of the sub-categories for the Empire Manufacturing report and how their measurements for current conditions and expectations changed relative to August. As shown, in terms of both Current Conditions and Expectations, the majority of categories declined. In terms of Current Conditions, Shipments showed a sizable decline, falling 11.4 points.
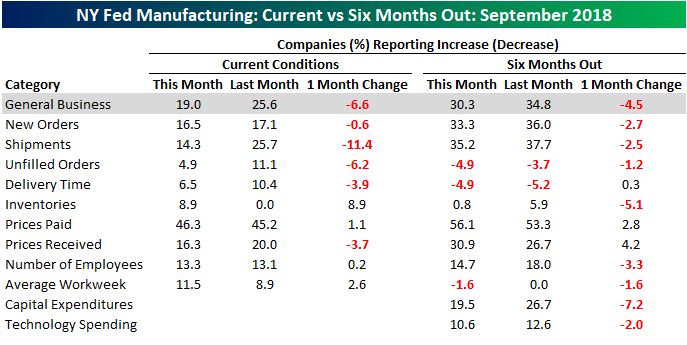
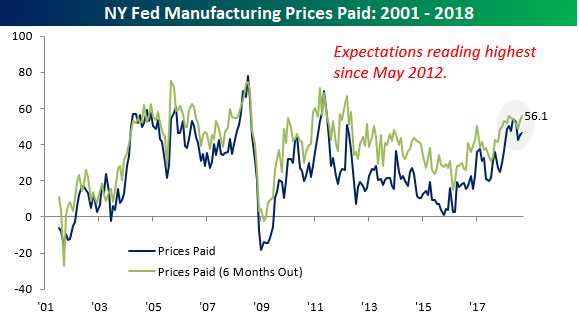
On the inflation front, Prices Paid increased in terms of both Current Conditions and Expectations with the latter index rising to its highest level since May 2012.
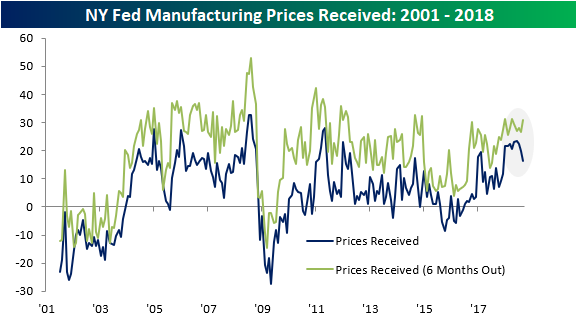
Within Prices Paid, there was a pretty wide disparity between Current Conditions (down) and Expectations (up).
Finally, with respect to the Average Workweek, manufacturers reported slight increases in the present but are expecting declines going forward as that index dropped into negative territory for the first time in two years.
Bespoke Brunch Reads: 9/16/18
Welcome to Bespoke Brunch Reads — a linkfest of the favorite things we read over the past week. The links are mostly market related, but there are some other interesting subjects covered as well. We hope you enjoy the food for thought as a supplement to the research we provide you during the week.
Housing Booms
How tech jobs helped Rust Belt become house-flipping hotspot by David Randall (Reuters)
As tech firms spread their hiring footprint into old Rust Belt cities, condos and single family homes near downtown centers are becoming hot markets for home flipping. [Link]
Las Vegas is booming again, and bracing itself for next slump by David Randall (Reuters)
Trying to diversify away from gambling is a big challenge but Las Vegas has more than just the Strip going for it: health care, start-ups, and anything but construction. [Link]
Real Estate Busts
New York’s World Trade Center Struggles to Fill Office Space by Peter Grant (WSJ)
Despite a long and strong economic recovery, the high end of the New York City office market is underperforming and that’s the primary reason why the World Trade Center is 20% unfillled. [Link; paywall]
Building Boom Unravels, Deepening Turkey’s Economic Crisis by Georgi Kantchev (WSJ)
The massive building boom that fueled a Turkey’s economy for years has run out of foreign funding thanks to the collapse in the lira, and as a result projects are being halted with disastrous consequences for would-be buyers. [Link; paywall]
Trading Troubles
Trader blows €100m hole in Nasdaq’s Nordic power market by Philip Stafford and David Sheppard (FT)
Live by the vol, die by the vol. In extremely volatile Nordic and German electricity markets, one trader had such a bad run that stability funds in Nasdaq clearing have run up nine figure losses cleaning up the mess of horrible trades. [Link; paywall]
The Incredible Shrinking Hedge Fund by Katherine Burton, Melissa Karsh, and Sam Dodge (Bloomberg)
Very large firms that used to dominate the landscape with $10s of billions in assets are now shadows of their former selves, battling against industry-wide outflows as well as underperformance. [Link; soft paywall]
Economics
Stephanie Kelton Wants You to Rethink the Deficit by Ben Walsh (Barron’s)
A profile on the public face of modern monetary theory, an economic argument that government deficits matter much less than we usually think. [Link; paywall]
Whither Labor Force Participation? by Rene Chalom, Fatih Karahan, Laura Pilossoph, and Giorgio Topa (NY Fed Liberty St Economics)
Labor force participation has flattened out, despite an aging workforce. Per this analysis by NY Fed economists, since 2016 more than half of the trend has been due to labor market tightening. [Link]
Can Anyone Other than the U.S. Fund a Current Account Deficit These Days? by Brad W. Setser (Council on Foreign Relations)
The vast majority of current account deficits around the world are found in emerging markets, where currencies are collapsing in a fine that they can’t be funded. Is the US the only one that can still fund a deficit? [Link]
Strange News
Author of ‘How to Murder Your Husband’ arrested for allegedly killing her husband by Storm Gifford (SunSentinel)
Life is apparently just as strange as fiction; 27 years earlier, accused murderer Nancy Crampton-Brophy penned an essay “How to Murder Your Husband”. [Link]
Meet the other empty nesters. They’re dogs and they miss the kids, too by Beth Teitell (The Boston Globe)
Won’t someone think of the pups? When children head off to college or homes of their own, family pets often feel the sting of an empty house just as much as parents. [Link]
Unlikely weapon: petanque balls help disarm Paris attacker by Thomas Adamson (AP)
Petanque, which is similar to bocce or lawn bowls, is apparently a highly effective supply of weapons for citizens defending themselves against a knife-wielding attacker. [Link]
Hackers Can Steal A Tesla Model S In Seconds By Cloning Its Key Fob by Andy Greenberg (Wired)
While Tesla may have made remote access to its systems more secure, if a hacker were to gain access to a car’s key fob, they would be able to clone it and get access to the care very quickly – not so different from traditional car keys. [Link]
Sports
The Sports Pages’ New Clothes by Aaron Gordon (Slate)
The Athletic is making what is old (paid coverage of local sports) new again, hiring local talent and charging users for very high quality reporting on the teams that they follow. [Link]
Athlete Banned From All-You-Can-Eat Restaurant for Eating All That He Could by Tim Forster (Eater)
A German triathlete plunked down about $19 for an all-you-can-eat sushi dinner, consuming 100 plates or about 18 pounds of sushi. [Link]
Read Bespoke’s most actionable market research by starting a two-week free trial today! Get started here.
Have a great Sunday!
2018 Week 2
Outside of financial markets, we’re sports fans here at Bespoke just like most people. With new legal sports betting avenues now available across the US, we figured we’d have some fun and pick each NFL game versus the spread (as of Saturday evening). Let’s see how we do…On to Week 2:
2018 NFL Week 2 Bespoke Picks:
Carolina at Atlanta (-6): Carolina +6
LA Chargers (-7.5) at Buffalo: LA Chargers -7.5
Minnesota at Green Bay (Even): Minnesota Even
Houston (-3) at Tennessee: Tennessee +3
Cleveland at New Orleans (-9.5): New Orleans -9.5
Miami at NY Jets (-2.5): NY Jets -2.5
Kansas City at Pittsburgh (-5): Kansas City +5
Philadelphia (-3) at Tampa Bay: Philadelphia -3
Indianapolis at Washington (-6): Indianapolis +6
Arizona at LA Rams (-13.5): LA Rams -13.5
Detroit at San Francisco (-6): San Francisco -6
Oakland at Denver (-6.5): Oakland +6.5
New England (-1.5) at Jacksonville: Jacksonville +1.5
NY Giants at Dallas (-3): NY Giants +3
Seattle at Chicago (-3): Chicago -3
Week 2 Picks: 7 Favorites, 7 Dogs, 1 Even; 7 Home, 8 Away
Week 1 Results (9-5), Overall (9-5):
2018 NFL Week 1 Bespoke Picks:
Pittsburgh (-3.5) at Cleveland: Pittsburgh -3.5 (Loss)
Cincinnati at Indianapolis (-2.5): Cincinnati +2.5 (Win)
Tennessee (-1) at Miami: Tennessee -1 (Loss)
San Francisco at Minnesota (-6.5): Minnesota -6.5 (Win)
Houston at New England (-6.5): Houston +6.5 (Loss)
Tampa Bay at New Orleans (-9.5): New Orleans -9.5 (Loss)
Jacksonville (-2.5) at NY Giants: NY Giants +2.5 (Loss)
Buffalo at Baltimore (-7.5): Baltimore -7.5 (Win)
Kansas City at LA Chargers (-3.5): Kansas City +3.5 (Win)
Seattle at Denver (-3): Seattle +3 (Push)
Washington (-1.5) at Arizona: Washington -1.5 (Win)
Dallas at Carolina (-2.5): Carolina -2.5 (Win)
Chicago at Green Bay (-7): Chicago +7 (Win)
NY Jets at Detroit (-7.5): NY Jets +7.5 (Win)
LA Rams (-4.5) at Oakland: LA Rams -4.5 (Win)
The Closer: End of Week Charts — 9/14/18
Looking for deeper insight on global markets and economics? In tonight’s Closer sent to Bespoke clients, we recap weekly price action in major asset classes, update economic surprise index data for major economies, chart the weekly Commitment of Traders report from the CFTC, and provide our normal nightly update on ETF performance, volume and price movers, and the Bespoke Market Timing Model. We also take a look at the trend in various developed market FX markets.
Below is a snapshot from today’s Closer highlighting the current positioning of speculators in futures markets. If you’d like to see more, start a free trial below.

The Closer is one of our most popular reports, and you can sign up for a free trial below to see it!
See tonight’s Closer by starting a two-week free trial to Bespoke Institutional now!
The Bespoke Report — Pros and Cons Edition
Retail Sales: The Streak Ends
When it comes to the September Retail Sales report, it has historically been one of the worst ones relative to expectations. Based on data from our Economic Indicators Database, the headline reading has only exceeded consensus expectations five times going back to 2001. That’s less than a third of the time! This year was no exception as we saw a big miss relative to expectations on the top line and a similar miss after stripping out Autos and Gas.
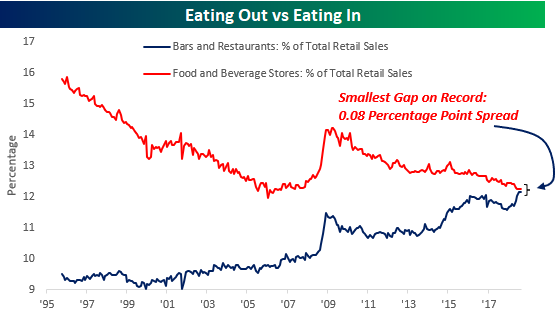
Our monthly update on Retail Sales, always highlights a number of key trends reflecting changing habits of the US consumer. This month’s report was no different. One interesting trend we wanted to highlight was the shift from ‘eating in’ to ‘eating out’. For several years now, we’ve seen Bars and Restaurants increase their share of total sales at the expense of Food and Beverage Stores. As shown in the chart below, though, this shift is on the verge of a major inflection point where Bars and Restaurants will overtake Food and Beverage stores in terms of their total share of retail sales. The house of tomorrow may not have a kitchen!
For anyone with more than a passing interest in the changing behavior of US consumers, make sure to check out this report. To see it, sign up for a monthly Bespoke Premium membership now!
The Closer — US vs The Rest, CPI Falters For Now, Dollar Slows — 9/13/18
Log-in here if you’re a member with access to the Closer.
Looking for deeper insight on markets? In tonight’s Closer sent to Bespoke Institutional clients, look into the drivers of the huge outperformance for US stocks versus the rest of the world. We also review today’s CPI report, the exploding US budget deficit, and the weakness of the USD that’s starting to manifest.

See today’s post-market Closer and everything else Bespoke publishes by starting a 14-day free trial to Bespoke Institutional today!