Trend Analyzer — US Index ETFs and Sector ETFs — 9/19/18
From our Trend Analyzer tool, ten major US Index ETFs are overbought, four are neutral, and none are oversold. Yesterday, we noted that most of the ETFs that were trading in overbought territory were just barely there, but yesterday’s gains pushed them to more overbought levels.
The Core S&P Small-Cap (IJR), Micro-Cap (IWC), Russell 2000 (IWM), and Nasdaq 100 (QQQ) are the only ETFs that are down from one week ago, and the Micro-cap ETF (IWC) once again remains the only ETF trading below its 50-DMA.
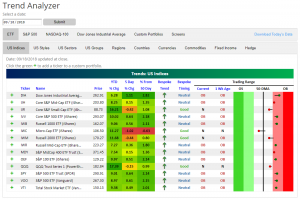
On the sector level, it is a similar story to yesterday with the major Index ETFs. Most sector ETFs are overbought, but not at extreme levels. Most notable of the sectors is Energy which currently sits slightly above the 50-DMA. This is a big change from one week ago when it was oversold. Conversely, the Telecommunications sector has seen the largest decline from one week ago. As you can see, it quickly fell out of the extreme overbought range.
The Closer — Metros Boomin’ — 9/18/18
Log-in here if you’re a member with access to the Closer.
Looking for deeper insight on markets? In tonight’s Closer sent to Bespoke Institutional clients, we discuss falling realized volatility and why they’re helping keep volatility low. We also review the likely avenue for China’s response to new US tariffs and Energy earnings relative to crude prices before discussing 2017 real GDP at the metropolitan statistical area level and some big shifts in international investor purchases of US financial assets.

See today’s post-market Closer and everything else Bespoke publishes by starting a 14-day free trial to Bespoke Institutional today!
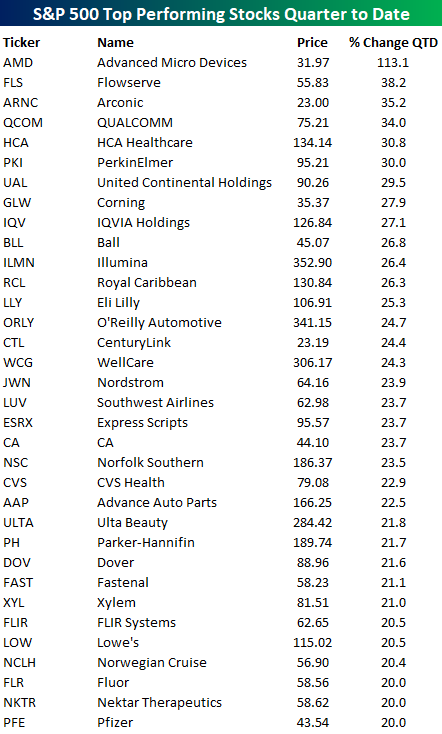
Best Performing S&P 500 Stocks QTD
With under two weeks left to go in the quarter, Q2 2018 is shaping up to be a good one for US equities. S&P 500 stocks have posted an average gain of 5.7% so far this quarter with over three-quarters of the index in the black. So much for the weak breadth argument! In terms of top performers, the 34 stocks listed below are all up 20% or more QTD. Leading the way higher is Advanced Micro (AMD), which is up an unbelievable 113%. Trailing way behind in AMD’s dust, the next best-performing stock on the list is Flowserve (FLS), which is still up a respectable 38% followed by Arconic (ARNC), QUALCOMM (QCOM), HCA Healthcare (HCA), and PerkinElmer (PKI), which are all up over 30%.
In terms of the FANG stocks, you have to go down to position number – wait. There are no FANG stocks on the list of top performers! 😱😱😱😱😱 In fact, in order to include even one FANG stock on this list, we would have to extend it to the top 100 stocks (AMZN – 95th). For the list to include two FANG stocks we would have to extend it to the top 300 names (GOOGL – 287th), and finally to include all the FANG stocks, we would simply have to show all the stocks in the S&P 500, as Facebook (FB) is all the way down at position number 490 in terms of its QTD rank. That’s right, only ten other stocks in the S&P 500 have done worse this quarter than Facebook.
Cash is Less Trashy
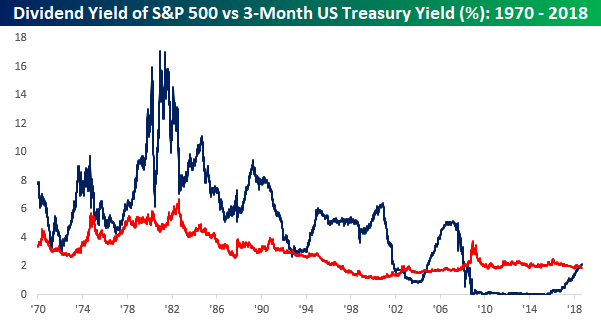
As interest rates have risen over the last few months, we have seen a number of charts similar to the one below comparing the yield on the 3-Month US Treasury (UST) to the dividend yield on the S&P 500. Up until just a couple of months ago, this entire bull market has occurred during a period where short-term interest rates have been lower than the dividend yield on the S&P 500. After over two years of rate hikes from the FOMC, though, short-term interest rates rose above the S&P 500’s dividend yield this summer and have continued higher ever since. With yields crossing this key inflection point, there’s been a decent amount of chatter that the higher yield on cash makes it more attractive than equities given their lower yield.
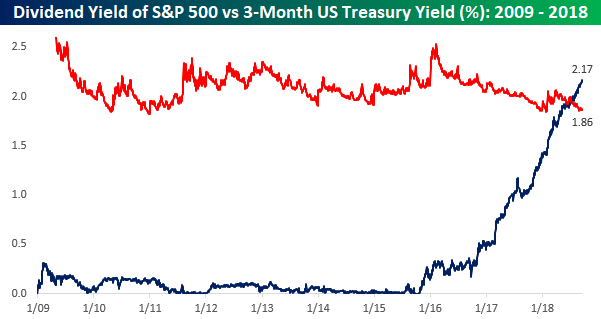
While any trader under the age of 30 (or algorithm using just ten years worth of history) has never known a world during their career where the dividend yield on equities was less than the yield on short-term Treasuries, those who are older or familiar with market history know that it is much more common for equities to yield less than short-term Treasuries. The chart below is the same as the one above except that instead of going back to just the start of 2009, it goes all the way back to 1970. As shown, prior to 2009, instances, where short-term Treasuries yielded less than the S&P 500 were few and far between. After all, unless you have some short-term needs for the capital, who would want to own an asset with zero upside potential (short-term treasury) if held through maturity that pays a lower coupon than equities, which outside of a couple of periods have always increased in value?
Below we compare the spread between the yield on the 3-month UST to the dividend yield of the S&P 500. While short-term Treasuries currently yield nearly 31 basis points (0.31%) more than the dividend yield of the S&P 500, that spread is still more than 150 bps below the historical average. Furthermore, even when the spread has been above the historical average, it has hardly represented a warning sign for equities. Throughout the entire mid to late 1990s period and nearly all of the 1980s (two very strong periods for equities), the spread was not only positive but well above the long-term average as well. The only thing that makes cash look less trashy when it is yielding marginally more than the S&P 500 is when it follows an outright garbage period of years where it yielded less.
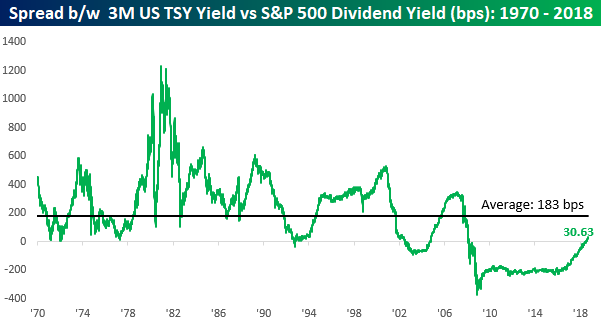
Chart of the Day: Trade By Night
Bespoke Stock Scores — 9/18/18
US Index ETFs — Trend Analyzer 9/18/18
From our proprietary Trend Analyzer tool, most major US Index ETFs have moved closer to neutral levels (from overbought) if they have not already reached it. As shown below, 8 index ETFs are just barely overbought, 6 are neutral, and none are oversold.
While most ETFs have moved lower towards their 50-DMAs over the last week, only the Micro-Cap ETF (IWC) has actually gone below the 50-DMA. IWC has been declining all of September but is still up 10.97% on the year. The Core S&P Small Cap ETF (IJR), Russell 2000 ETF (IWM), and Nasdaq 100 (QQQ) are the other prominent movers back toward their 50-DMAs. Conversely, the Dow Jones Industrial Average (DIA) has seen the biggest gain in the last week at +0.79%. It is also the highest above the 50-DMA, but it should be noted that’s it’s still not strongly overbought.

The Closer — Industrials & Real Yields Rip, Ag Prices Slip, Brazil Votes, Loans Slow — 9/17/18
Log-in here if you’re a member with access to the Closer.
Looking for deeper insight on markets? In tonight’s Closer sent to Bespoke Institutional clients, we review a recent rip in Industrial stocks, new cycle highs for 5 year real yields, and 52-week lows for agriculture prices. We also discuss upcoming Brazilian elections, the New York Fed’s Empire Manufacturing survey, and again-weakening core loan growth.
See today’s post-market Closer and everything else Bespoke publishes by starting a 14-day free trial to Bespoke Institutional today!
S&P 500 Average Daily Change Down to +/-0.40%
2017 was one of the least volatile years ever for the US equity market. The S&P 500 averaged an absolute daily change of just 0.30% last year.
Due to a pick-up in volatility during the S&P’s correction in the first quarter, the average absolute daily change for the index is more elevated this year at +/-0.64%, but more recently we’ve seen a pretty big drop in the action. As shown in the chart below, the S&P has averaged an absolute change of just +/-0.40% over the last 50 trading days, which is well below the average of 0.70% seen throughout the current bull market.
From a seasonal perspective, September and October have historically been the most volatile months of the trading year, but so far this September, the S&P has averaged a daily move of less than 0.24%. It’s starting to feel like 2017 all over again!
