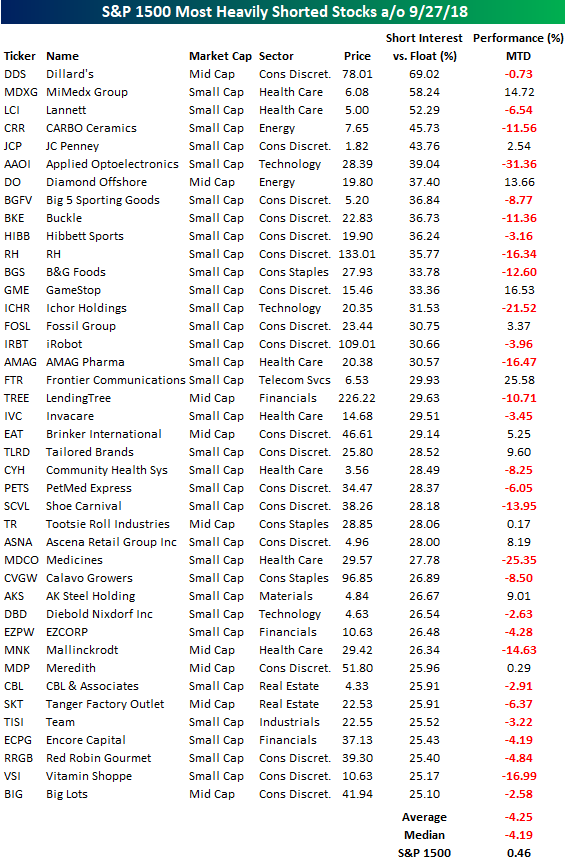
Most Heavily Shorted Stocks Tank in September
We published our regularly updated Short Interest Report earlier today in order to show clients which areas of the market are seeing the biggest increases and decreases in short interest levels. A supplement to the report is the table below highlighting the most heavily shorted stocks in the S&P 1500.
Notably, the most shorted stocks got crushed in September (through 9/27), falling 4.25% on average compared to a small gain for the S&P 1500. While the stock market was up in September, it wasn’t a great month for stocks that the shorts are bettign heavily against.
Dillard’s (DDS) is the most heavily shorted stock in the entire S&P 1500 with 69% of its float sold short. Two other stocks in the index have more than 50% of their shares sold short — MiMedx Group (MDXG) and Lannett (LCI). Some of the other stocks on the list below that got hit the hardest in September include Applied Opto (AAOI), Ichor Holdings (ICHR), and Medicines (MDCO), which all fell more than 20%.
Equities may have traded higher in September, but it looks like the shorts were still able to make plenty of money.

B.I.G. Tips – October 2018 Seasonality
Bespoke Short Interest Report: 9/28/18
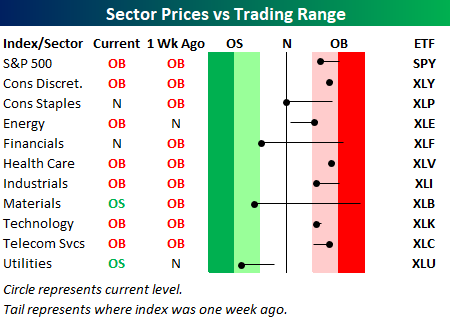
Morning Lineup – Back to Markets
Investors are getting back to focusing on markets this morning yesterday’s spectacle in Washington has come and gone. With just one trading day left in the week though, we thought it would be a good idea to highlight where things stand on a sector by sector level.
The chart below is from the second page of our Morning Lineup and shows where sectors are trading with respect to their trading ranges and how they’ve moved over the last week. The S&P 500 and most sectors continue to trade at overbought levels, although everyone with the exception of Energy and Communication Services has moved lower with respect to its trading range over the last week. The big movers, though, have been Materials and Financials, which have moved from overbought to either oversold or near oversold in the course of only a week. While it’s perfectly normal for sectors to ‘digest’ gains after a big move, those kinds of shifts aren’t particularly normal and suggest a good deal of uncertainty towards the sectors on the part of investors.
Start a two-week free trial to Bespoke Premium to see today’s full Morning Lineup report. You’ll receive it in your inbox each morning an hour before the open to get your trading day started.

The Closer — Hard Data Wave — 9/27/18
Log-in here if you’re a member with access to the Closer.
Looking for deeper insight on markets? In tonight’s Closer sent to Bespoke Institutional clients, we wade through an enormous wave of data released in the US today covering GDP, trade, manufacturers’ sales, new orders, and inventories, and inventories. We also discuss our now-complete Five Fed Index of regional manufacturing activity and some odds and ends from equity, credit, and FX markets.

See today’s post-market Closer and everything else Bespoke publishes by starting a 14-day free trial to Bespoke Institutional today!
Bespoke’s Sector Snapshot — 9/27/18
Chart of the Day: Mosaic (MOS)
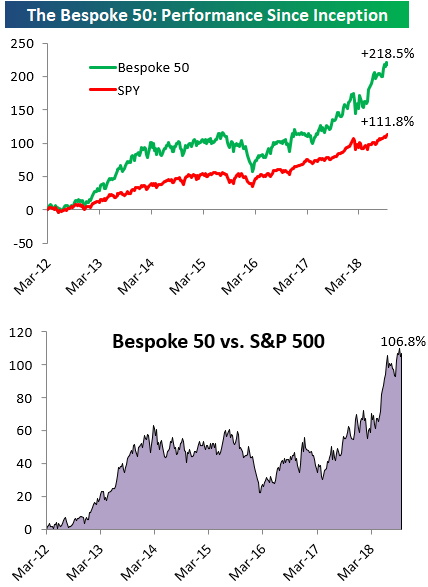
the Bespoke 50 — 9/27/18
Every Thursday, Bespoke publishes its “Bespoke 50” list of top growth stocks in the Russell 3,000. Our “Bespoke 50” portfolio is made up of the 50 stocks that fit a proprietary growth screen that we created a number of years ago. Since inception in early 2012, the “Bespoke 50” has beaten the S&P 500 by 106.8 percentage points. Through today, the “Bespoke 50” is up 218.5% since inception versus the S&P 500’s gain of 111.8%. Always remember, though, that past performance is no guarantee of future returns.
To view our “Bespoke 50” list of top growth stocks, click the button below and start a trial to either Bespoke Premium or Bespoke Institutional.
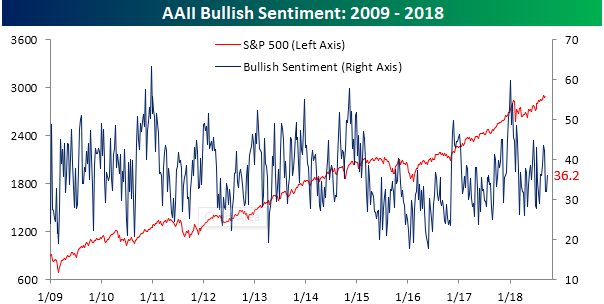
Individual Investors Turn a Bit More Bullish
With the Dow Jones – America’s “Main Street” equity index – joining the S&P at new highs to close out last week, we were not too surprised to see that individual investors turned more bullish in the latest week. But even after the increase, positive sentiment remains at extremely depressed levels given what the market has done recently. According to the weekly survey from AAII, bullish sentiment rose from 32.04% up to 36.22%. That’s still below the average reading of 36.7% for the current bull market.
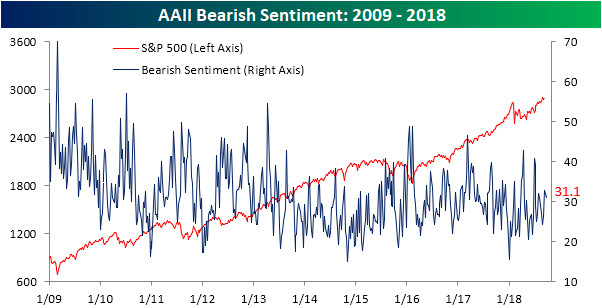
Even with the increase in bullish sentiment, bearish sentiment barely declined, falling less than one percentage point from 32.0% down to 31.1%.
The main source for the increase in bullish sentiment came from the ‘fence-sitters’ as neutral sentiment declined from 35.9% down to 32.7%.

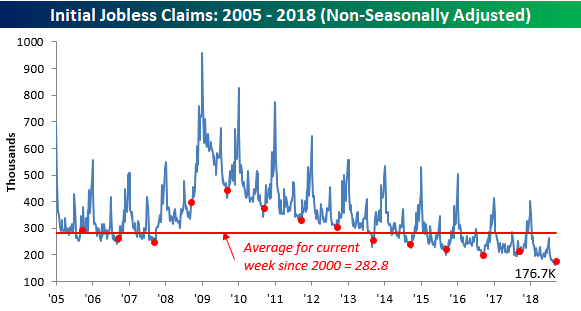
Jobless Claims Rise More Than Expected
Before we go any further this morning, we hope you’re sitting down for this one because it’s a shocker. OK, are you ready for it? Here it goes. This week’s report on initial jobless claims was actually a bit disappointing. While economists were expecting claims to tick up to 210K, the actual reading came in at 214K. This week’s increase represents the largest one week rise in claims since May and put the actual reading at the highest level in a month. Even with the ‘disappointing’ report this morning, this week’s claims number represents the 186th straight week where claims were at or below 300K, the 51st straight week where claims were at or below 250K (longest streak since 1970), and the 12th week where claims were at or below 225K. So even a disappointing report wasn’t all that bad in the grand scheme of things.
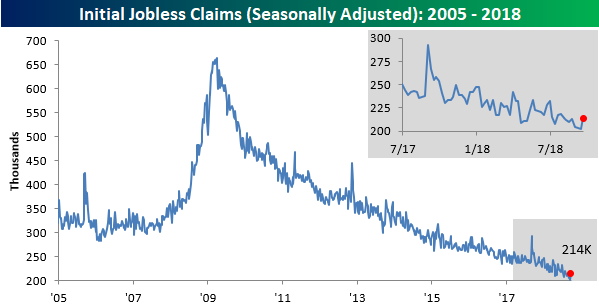
Although claims rose by 12K this week, the four-week moving average only rose by 250 to 206.25K, so that’s still right near the multi-decade low that was reached last week.

Finally, on a non-seasonally adjusted basis, jobless claims rose from 169.2K up to 176.7K. Even with the increase, though, it’s the lowest reading for the current week of the year since 1969 and more than 100K below the average of 282.8K for the current week of the year dating back to 2000.