Sector Heatmaps
Stock market rotation has been a pretty big theme this year but you wouldn’t necessarily know it from our sector performance heatmap. Below we show which sectors have the best and worst performances YTD over the course of the year. Three have been outperformers for most of the year: Consumer Discretionary, Health Care, and Technology. Underperformers have been less consistent. Communications Services and Consumer Staples have lagged pretty consistently, but Staples has started to turn itself around. Utilities lagged badly to start the year but is now an outperformer, while Financials started off on good footing but have lagged into the close of the year. The Industrials sector looks similar to the Financials sector — it was in the top half of performers through April before losing steam. At this point in the year, Industrials are one of the weaker sectors in terms of YTD performance.
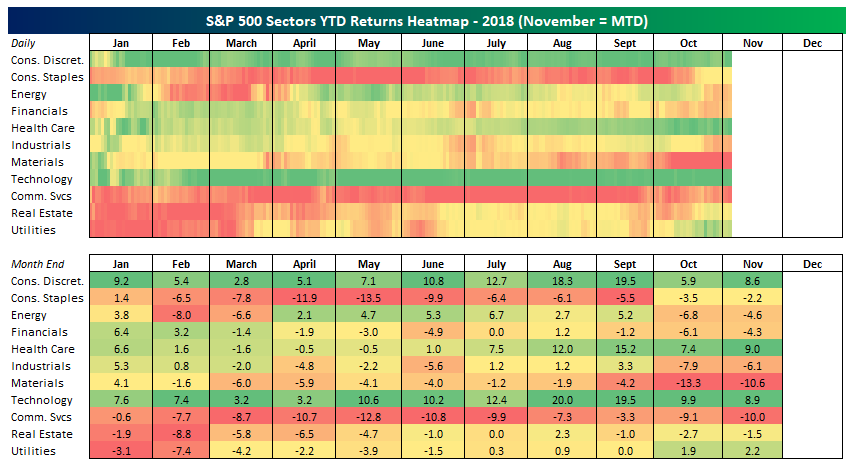
Another way to show rotating fortunes at the sector level is to use our rolling heatmap of S&P 500 sector performance. As shown below, only two sectors (Utilities, Health Care) are up over the last three months; Communications Services and Real Estate have started to outperform as well. The big laggards are Energy and Materials, which have been falling behind on a rolling 3 month basis for quite some time now.
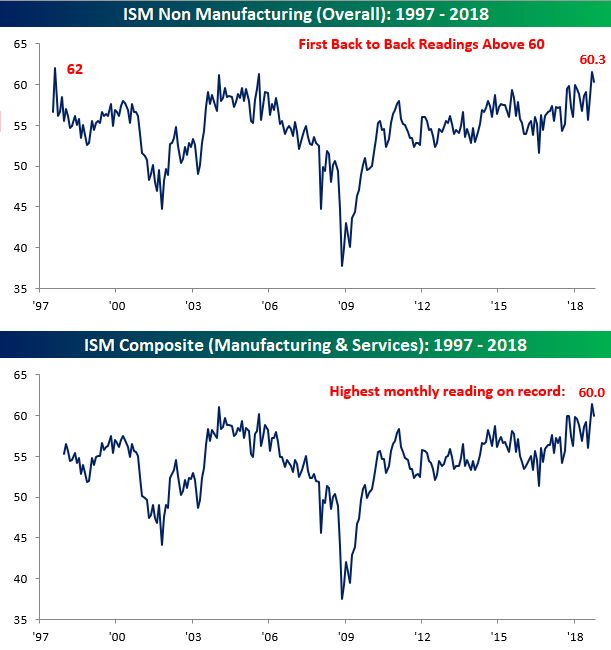
Chart of the Day – Trend Shifts in S&P 500 200-Day Moving Average
Bespoke Stock Scores — 11/6/18
Bespoke CNBC Appearance (11/5)
Bespoke Co-Founder Paul Hickey appeared on CNBC’s Power Lunch to discuss markets, the economy, and elections. To view the segment, please click on the image below.

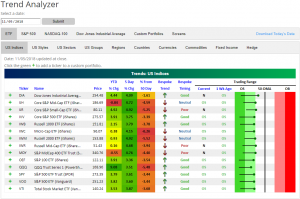
Trend Analyzer – 11/6/18 – Former Laggards Lead the Way
Things are continuing to look better in our Trend Analyzer. While the majority still sit oversold, there are finally multiple major US Index ETFs that are back in neutral territory. With momentum back towards the 50-DMA over the past week — as can be seen by the long tails — even those that are still oversold are very close to neutral territory.
During the October sell-off, we had been highlighting small and mid cap weakness. As buyers have come back over the past week, there has been a little bit of rotation into these former laggards. Among those that have moved back to neutral, three are small and mid cap focused (IJR, IWR, and MDY). These are also up the most over the past week.
Morning Lineup – Time to Vote
US equity markets are indicated lower at the open as Europe tries to recover from morning selling. The USD is down for the third day in four, energy markets are edging higher, and precious metals are also trading green. Rates markets are generally trading higher in price, but yield moves are fractional, less than 1 basis point across the curve.
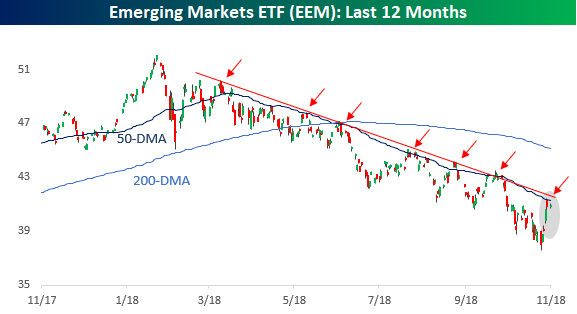
Yesterday, we highlighted the fact that despite the rally last week, the S&P 500 had not yet broken its string of lower highs and that until then caution was warranted. Well, if you are looking for an example of why it often pays to wait for a market to break a downtrend before starting to go long, look no further than emerging markets. The chart below shows the performance of the MSCI Emerging Markets ETF (EEM) over the last year. Since its peak earlier this year, EEM has had no fewer than seven rally attempts. While each one of these rallies may have seemed like a significant bounce at the time, up until this point, every single one of them has failed right at or around the 50-day moving average, establishing a lower high.
Start a two-week free trial to Bespoke Premium to see today’s full Morning Lineup report. You’ll receive it in your inbox each morning an hour before the open to get your trading day started.

The Closer — Same Story As The Rally, Cheap Gas, Americas Auto Sales — 11/5/18
Log-in here if you’re a member with access to the Closer.
Looking for deeper insight on markets? In tonight’s Closer sent to Bespoke Institutional clients, we argue that despite underwhelming returns for small caps today and large caps below Friday’s highs, the market is still following the same script as it did off recent index lows. We also discuss brutal gasoline price action and October auto sales data from non-US economies in the Americas.

See today’s post-market Closer and everything else Bespoke publishes by starting a 14-day free trial to Bespoke Institutional today!
Chart of the Day: End-of-Day Buyers Return
Services Sector Remains Strong
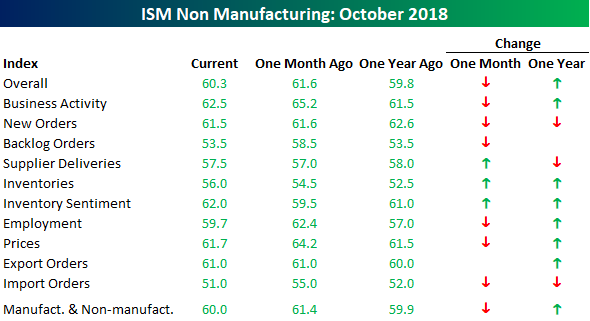
The ISM Services report for the month of October declined less than expected, falling from 61.6 down to 60.3 compared to expectations for a reading of 59.0. Even though the pace of growth declined, though, it was the first time in the history of the report dating back to 1997 that the headline index posted back to back readings above 60. With both the manufacturing and services data now in, accounting for each sector’s weight in the overall economy, the October Composite ISM fell from 61.4 down to a still very high reading of 60.0. Since composite data for the index begins in the late 1990s, there have only been four readings of 60 or above, and two of them came in the last two months!
The table below breaks down this month’s report by each of its sub-components and shows how they stand relative to September and last October. On a m/m basis, breadth in this month’s report was weak with just three categories showing m/m increases, while Backlog Orders and Import Orders saw the largest declines. On a y/y basis, things look considerably better as the only components down were New Orders, Import Orders, and Supplier Deliveries.
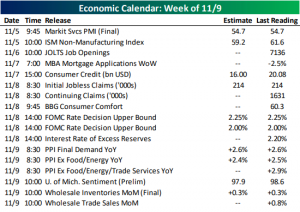
This Week’s Economic Indicators – 11/5/18
Last week was extremely busy in terms of economic data. ISM and PMIs data all pointed towards slowing in the manufacturing sector. The week was capped off with the most watched release of the week: the Nonfarm Payrolls Report. Payrolls increased by 50,000 more than expected alongside rising wages in October. Other employment data from ADP, Jobless Claims, and ECI echoed the positive NFP results. This continuously strong labor data is not a great sign for the market seeing as the Fed will now be more likely to maintain their hawkish tone.
Coming up this week is a far quieter slate with only 19 releases versus last week’s 39. This morning, Markit Services PMI and ISM’s Non-Manufacturing Index were released. Tuesday, we will get further labor market data with the release of JOLTS. Following that, all eyes will be on the Fed. As we previously mentioned, all of the recent employment data is set to have a big impact on Fed policy. On Thursday, the FOMC will hold their seventh rate decision meeting of the year. While no change is expected for this decision, investors will still be fixated on the Fed’s tone. Finally, on Friday the week will finish off with producer inflation data.
You can always check our Economic Monitor to keep up with the day’s releases.