Apple (AAPL) Farthest Below 50-Day Moving Average in 10 Years
Yesterday we noted that Apple (AAPL) is currently in the midst of its 4th 20%+ drawdown in the iPhone era. Below we highlight Apple’s (AAPL) price relative to its 50-day moving average (DMA). As shown in the first chart below, AAPL’s share price has plunged well below its 50-DMA on this recent move lower.
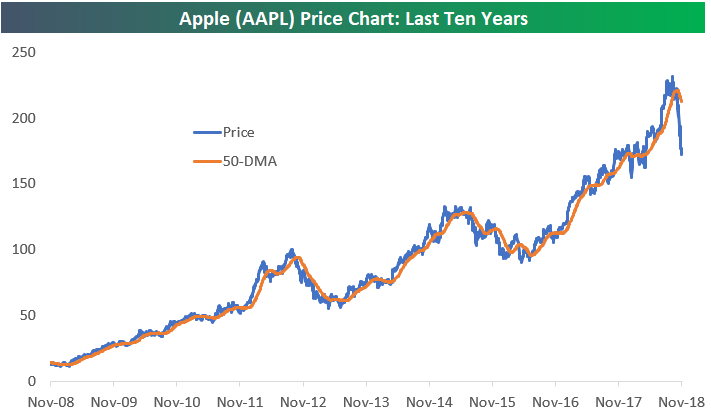
Just how far is Apple (AAPL) below its 50-day moving average? At -19.02%, this is the farthest AAPL has been below its 50-DMA in 10 years dating back to the Financial Crisis. AAPL hasn’t been this far below its 50-DMA throughout the entire bull market for equities that began on March 9th, 2009. Talk about brutal action lately!

Bespoke’s Sector Snapshot — 11/23/18
Apple Falls Hard From the Tree
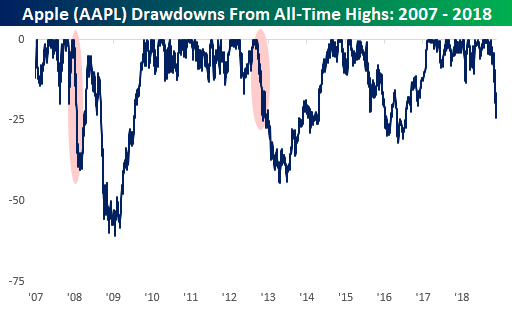
With a decline of nearly 25% in less than eight weeks, the recent plunge in Apple (AAPL) has been noteworthy enough, but when you consider the fact that it came from a point where the company had a market capitalization of over $1.1 trillion, we’re not sure if a company has ever lost that much in market cap over such a short period of time. Heck, the $284 billion in market cap that has disappeared from AAPL since its high in early October is greater than the entire market cap of all but nine companies in the US.
The chart below shows historical drawdowns in AAPL stock from an all-time high going back to when the iPhone was first introduced. The current 20%+ decline is the fourth such drop of more than 20%. Of those prior drawdowns, the only two where the stock dropped by more than 20% in less than 40 trading days occurred in 2008 when the rest of the market was weak as well as 2012 when concerns over competition and shortages of the iPhone 5 hurt results.
Rude Crude
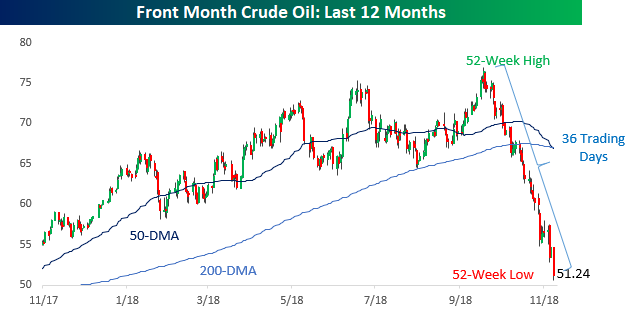
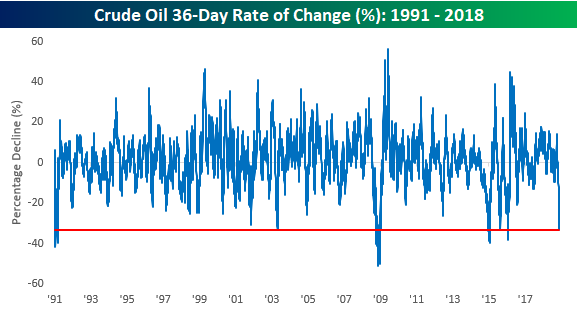
While US equities are set to trade lower on this holiday-shortened day after Thanksgiving, the big story is the sharp drop in crude oil prices. Crude is trading down over 5% this morning to another 52-week low near $50 per barrel. Looking at the chart, it’s amazing to see how sharp and fast the drop has been from what were multi-year highs just a few short weeks ago. In the span of just 36 trading days, prices have dropped by about a third!
Looking back at crude oil declines over time, the magnitude of this drawdown is right up there with some of the biggest on record. The last time prices were down this much from a 52-week high was in 2015 and 2016, but the key difference between now and then is that the magnitude and length of this decline (at least up until this point) has been shorter and less severe.
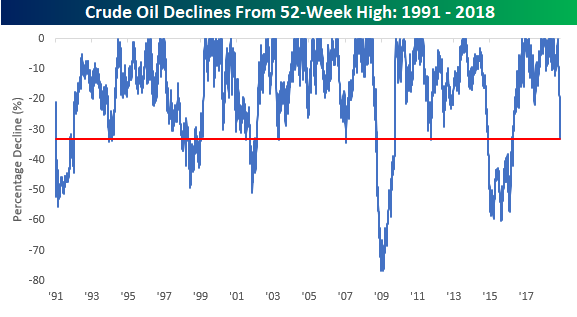
We realize that measuring a 36-day rate of change is a bit arbitrary, but just to show how sharp a decline this has been, there haven’t been many other similar lengths of time where crude oil declined more over a such a short period of time.
Country Stock Market ETFs Down Double-Digits in 2018
Below is a look at the year-to-date percentage change of the 34 country stock market ETFs tracked in our popular Trend Analyzer tool. As shown, just 2 out of 34 countries are in positive territory for the year, while 32 of 34 are in the red. The best performing country stock market ETF has been Israel with a gain of 4.7%, while the US (SPY) is the only other country in positive territory with a gain of 0.6%. (While SPY is up YTD still, the S&P 500 is actually down 0.89%, however.)
The average YTD change for all country ETFs is currently -12.7%. Turkey (TUR) has posted the biggest decline at -42.1%, followed by South Africa (EZA) at -25.8% and South Korea (EWY) at -20.4%. The Philippines (EPHE), Germany (EWG), Italy (EWI), and Mexico (EWW) round out the worst 7 countries. A large majority of countries (70%) are down double-digit percentage points on the year. 2018 is shaping up to be a very brutal year for global equities.

Bespoke Morning Lineup – Short But Not Sweet
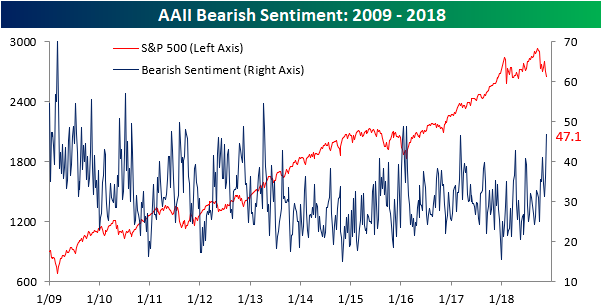
It was bound to happen sooner or later given the weakness, and we started to see it this week as individual investors grow increasingly nervous. In this week’s sentiment survey from AAII, bearish sentiment ticked up to its highest level since February 2016.
Start a two-week free trial to Bespoke Premium to see today’s full Morning Lineup report. You’ll receive it in your inbox each morning an hour before the open to get your trading day started.

2018 Week 12 Thanksgiving Day NFL Picks
Week 11 Results: 8-4, Overall: 85-59 (59.02%)
Outside of financial markets, we’re also sports fans here at Bespoke. With new legal sports betting avenues now available across the US, we figured we’d have some fun and pick each NFL game versus the spread this season (as of Saturday evening). This week we’ve got a special Thanksgiving Day picks edition to cover the three games scheduled for Turkey Day.
We were 8-4 in week 11, bringing our overall record through 11 weeks to 85-59 (59.02%).
2018 NFL Thanksgiving Day Picks:
Chicago (-3) at Detroit: Chicago -3
Washington at Dallas (-7): Dallas -7
Atlanta at New Orleans (-12.5): Atlanta +12.5
2018 NFL Week 11 Bespoke Results:
Carolina (-4.5) at Detroit: Detroit +4.5 (Win)
Dallas at Atlanta (-3): Dallas +3 (Win)
Cincinnati at Baltimore (-5.5): Cincinnati +5.5 (Win)
Minnesota at Chicago (-2.5): Minnesota +2.5 (Loss)
Philadelphia at New Orleans (-7.5): Philadelphia +7.5 (Loss)
Tennessee at Indianapolis (-1.5): Indianapolis -1.5 (Win)
Houston (-3) at Washington: Washington +3 (Win)
Tampa Bay at NY Giants (-2.5): NY Giants -2.5 (Win)
Denver at LA Chargers (-7): LA Chargers -7 (Loss)
Oakland at Arizona (-5.5): Oakland +5.5 (Win)
Pittsburgh (-5.5) at Jacksonville: Pittsburgh -5.5 (Loss)
Kansas City at LA Rams (-3.5): Kansas City +3.5 (Win)
Chart of the Day: No Low in New Lows
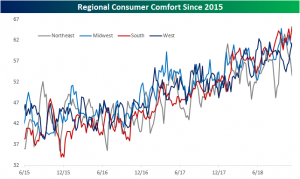
Consumer Comfort Slowing But Still Very Strong
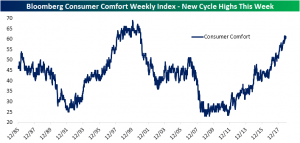
Bloomberg’s weekly consumer comfort data released this morning at 61.3. Consumer comfort is still very close to cycle highs (61.6), but over the past couple of months—during the time markets have been selling off—it hasn’t not been steadily moving higher as it did for most of the year, instead staying within a range of 59 to 61. This slowing is by no means a negative sign seeing as the level is still so strong. Given the equity market’s recent price action, it may simply be the wealth effect dampening.
Breaking comfort levels down by demographic, the same trends still seem to be in place. Most readings are still in high percentiles compared to history, meaning comfort is still high across the board. Those with lower income and education levels unsurprisingly remain at the bottom, while higher-income individuals sit at the top. Also near the bottom of the group is Democrats, which as we have highlighted in the past is normal for the out of power party. On that note, the reading is still higher for both Republicans and Democrats since the election likely due to both sides perceiving wins.
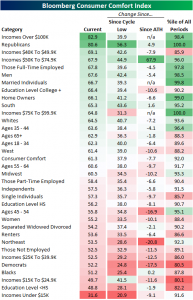
Geographically, there was a big drop in comfort in the Northeast. These demographics are some of the more volatile ones though—as you can see in the chart below—so it is not necessarily a bad sign. The Northeast especially has seen many of these huge drops throughout the history of the survey. There was an even larger fall only a few months ago. In other words, while Northeast comfort may seem bad, with its level being one of the lowest demographics in regards to its percentile, it should not raise any red flags, and we could very easily expect this low comfort level to turn around.
Bespoke CNBC Appearance (11/21)
Bespoke co-founder Paul Hickey appeared on CNBC’s Squawk Box this morning to talk about the market, the FOMC, and recent market action. To view the segment, please click on the image below.
