Morning Lineup – First Back to Back Gains of the Month?
A number of positive reactions to earnings reports are driving the market higher to close out the month as shares of Facebook (FB) are trading up 5% and General Motors (GM) is up 8%. Strength in foreign markets on the heels of dovish comments from the BoJ and Chinese officials is also contributing to the positive tone in futures as bulls try and salvage something from what had been a horrible month for US and global equities.
Even though it looks to be ending on a positive note, bulls will no doubt be happy to see this October come to an end. While the monthly performance numbers will look a bit more respectable with the gains we are likely to see in the final two trading days, as of Monday’s close, the 20-day rate of change in the S&P 500 was one of the weaker readings we had seen during this bull market. In fact, it was the weakest reading we had since August 2015. As it always does (eventually), the market recovered from that decline in August 2015, but it was one of the shakier six-month periods that equities have seen during the current bull market. It wasn’t until February of 2016 that stocks finally made a low and began their epic run.

Start a two-week free trial to Bespoke Premium to see today’s full Morning Lineup report. You’ll receive it in your inbox each morning an hour before the open to get your trading day started.

The Closer — Real Rates, Industrials, Housing — 10/30/18
Log-in here if you’re a member with access to the Closer.
Looking for deeper insight on markets? In tonight’s Closer sent to Bespoke Institutional clients, we look at whether industrials outperformance has been helpful in identifying broader market bottoms. We also note still-high real rates despite the broader fixed income rally in recent weeks. Finally, we dive into housing data released today including Case-Shiller Home Price indices for August and Q3 data on household formation and vacancy rates.

See today’s post-market Closer and everything else Bespoke publishes by starting a 14-day free trial to Bespoke Institutional today!
Chart of the Day: Pulse Underperforms
25% Off At Amazon.com
It’s hard to believe but less than two months ago, Amazon.com (AMZN) was trading over $2,000 a share and briefly enjoyed a market cap of over $1,000,000,000,000.00. That’s right — a trillion dollars! Those days seem long gone now, though, as today AMZN is trading under $1,500 and down more than 25% from its recent highs. He may still be the richest person in the world, but Jeff Bezos now also owns the record for losing more wealth in the course of two days ($19.2 billion) than any other person.

While pretty uncommon in recent years, 25% drawdowns in the stock of AMZN have been relatively frequent. The last drawdown from a record closing high was back in February 2016 when AMZN was briefly down 30% from its previous high, and going back to the lows of the Financial Crisis in 2009, there have been a total of five prior drawdowns of more than 25% (red line). Also, while it is a little bit of a misleading statistic, AMZN has actually spent nearly half of its existence as a public company down at least 25% from its prior all-time closing high. The seven year stretch from 2000 to 2007 accounts for a big chunk of that percentage, but it does serve as a reminder that stocks don’t always trade right near all-time highs.


B.I.G. Tips – Consumers Still Confident
Despite turmoil in the stock market this month, US consumers remain optimistic. In the Conference Board’s read of consumer sentiment for the month of October, the headline index came in higher than expected, rising from 135.3 (revised from initial reading of 138.4) to 137.9 compared to expectations for a reading of 135.9. As shown in the chart below, October’s level is the highest since September 2000. As is usually the case, this month’s report highlights a number of important trends regarding the economy and financial markets that investors should be aware of.

In a just-published B.I.G. Tips report, we went through the details of this month’s Consumer Confidence report and highlighted some of the key trends investors should be aware of. To unlock immediate access to this report, sign up for a monthly Bespoke Premium membership now!
Trillions in Losses
Since the US stock market peaked on a closing basis back on September 20th, Russell 3,000 stocks have collectively lost roughly $3.5 trillion in market cap. Breaking the losses down by market cap, the 50 largest stocks in the US have lost roughly $1.25 trillion in market cap, while the 2,000 smallest have lost $350 billion.
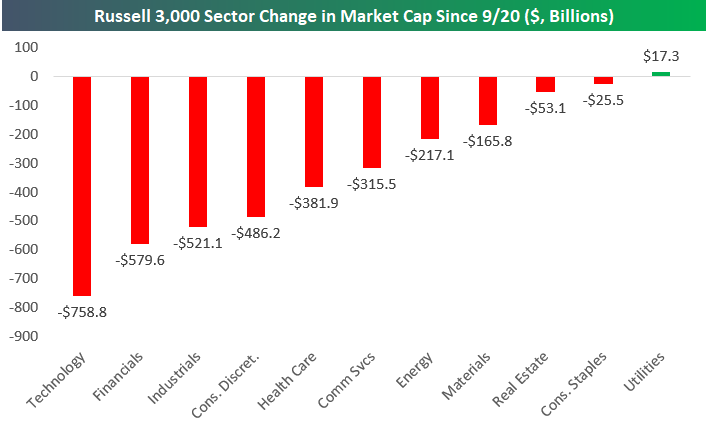
Below we show Russell 3,000 sector market caps as they stood on 9/20 and as they stand now, while in the second chart we show the change in market caps since 9/20.
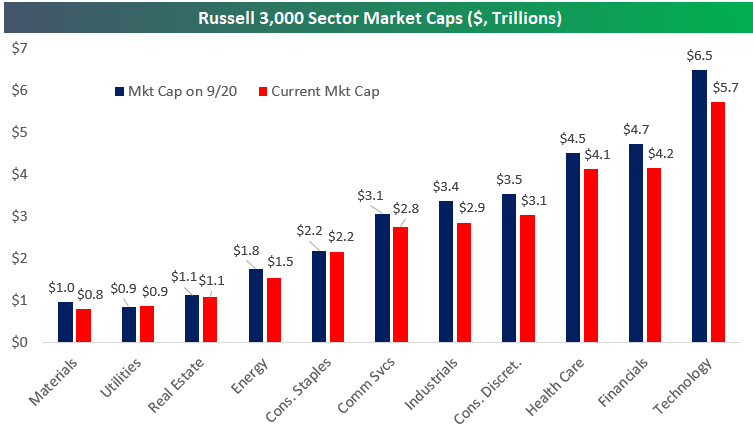
As shown, Technology has lost by far the most market cap since the peak at -$758.8 billion, which isn’t surprising given that it’s the largest sector of the market. Financials have lost the second most at -$579.6 billion, followed by Industrials at -$521.1 billion and Consumer Discretionary at -$486.2 billion.
One sector — Utilities — has actually seen an increase in market cap since 9/20 as investors have rotated out of cyclicals and into defensives.
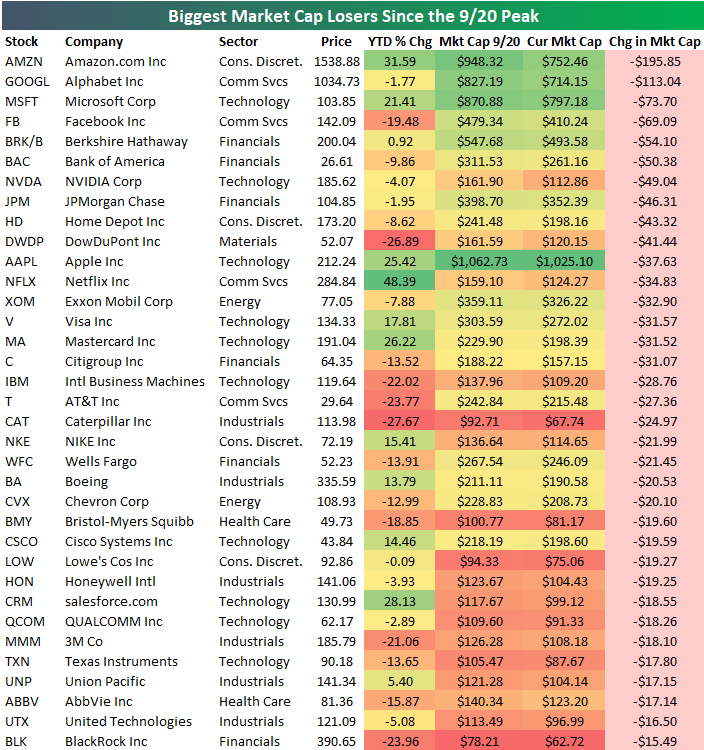
Below is a list of the individual stocks that have lost the most market cap since the 9/20 peak. Amazon.com (AMZN) has lost the most at -$195.85 billion, while Alphabet (GOOGL) ranks second worst at -$113 billion. Microsoft (MSFT), Facebook (FB), and Berkshire Hathaway (BRK/B) round out the top five with losses of more than $50 billion each.
Bespoke Stock Scores — 10/30/18
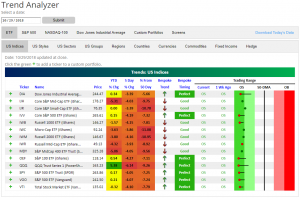
Trend Analyzer – 10/30/2018 – Seeing Red
As lower closes have become more or less the norm lately, the major US Index ETFs from our Trend Analyzer continue to look worse and worse. Every one of the members of this group is still deeply oversold. More concerning is that half of these are now in downtrends after declining all of October. Once again those fairing the worst are predominantly comprised of small to mid-caps. Up until this point, the other members of this group had held up relatively well. Even though they have been declining this month, they had not gone under levels from the start of the year. This does not hold as true anymore. An increasing number have either gone negative on the year or are close to it. The Nasdaq (QQQ) is the only one up more than 1% YTD. Furthermore, QQQ is a far cry from where it had been just one week ago. This time last week it had seen YTD gains of 12.28%, but since that time, QQQ has fallen 6.14%, cutting these gains by more than half to 5.38% YTD.
Morning Lineup – Another Gap Higher
The S&P 500 is looking to open higher again this morning following some crazy late-day trading yesterday. It may sound hard to believe, but today’s positive open will be the 11th time in 22 trading days this month that equities opened the day higher. Even though this has been one of the worst Octobers on record and the worst month in years, stocks have had positive opens on half of the trading days this month. The problem, as we all know by now, is what happens once that opening bell rings; there have only been six trading days where stocks have finished the day higher than they open.
For the full recap of all the major overnight developments around the globe, check out the full Morning Lineup.
When it comes to financial markets, the last few weeks provide a great example of how quickly gains can vanish. The chart below is from page two of our Morning Lineup, and it shows the relative strength of the S&P 500 vs the US Treasury Long Bond Future over the last year. When the line is rising it indicates outperformance from equities and vice versa.
It was only a month ago that the performance of equities was leaving treasuries in the dust, but in the span of less than one month, equities have given up more than half of their outperformance relative to Treasuries. Less than a month!

Start a two-week free trial to Bespoke Premium to see today’s full Morning Lineup report. You’ll receive it in your inbox each morning an hour before the open to get your trading day started.
The Closer — EEM New Lows, Sector Dispersion, PCE, Manufacturing, Capex — 10/29/18
Log-in here if you’re a member with access to the Closer.
Looking for deeper insight on markets? In tonight’s Closer sent to Bespoke Institutional clients, we dive into how Tech is dragging down the market, or maybe more accurately how it isn’t holding the market up like it used to. We also take a look at some very bearish stats related to breadth today, the decline in EEM, and economic analysis in the form of personal income and spending, the last piece of data for our Five Fed Manufacturing index in October, and the outlook for capex spending.
See today’s post-market Closer and everything else Bespoke publishes by starting a 14-day free trial to Bespoke Institutional today!