the Bespoke 50 — 11/1/18
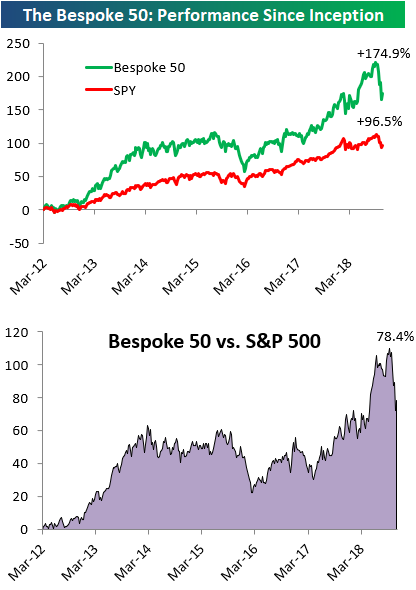
Every Thursday, Bespoke publishes its “Bespoke 50” list of top growth stocks in the Russell 3,000. Our “Bespoke 50” portfolio is made up of the 50 stocks that fit a proprietary growth screen that we created a number of years ago. Since inception in early 2012, the “Bespoke 50” has beaten the S&P 500 by 78.4 percentage points. Through today, the “Bespoke 50” is up 174.9% since inception versus the S&P 500’s gain of 96.5%. Always remember, though, that past performance is no guarantee of future returns.
To view our “Bespoke 50” list of top growth stocks, click the button below and start a trial to either Bespoke Premium or Bespoke Institutional.
The Closer — Cuts Priced, RSI Divergence, Wages Up, Crude Outlook Brightens — 10/31/18
Log-in here if you’re a member with access to the Closer.
Looking for deeper insight on markets? In tonight’s Closer sent to Bespoke Institutional clients, we identify a broad positive technical signal across global equity markets. We also discuss still-rising earnings estimates in the US and Europe, priced rate cuts in the US in the two years starting a year from today, weekly EIA petroleum inventory data, and the employment cost index release today that showed further acceleration in US wage growth.

See today’s post-market Closer and everything else Bespoke publishes by starting a 14-day free trial to Bespoke Institutional today!
Chart of the Day: What’s Next?
Crude Inventories: Up, But Inline
The EIA updated their weekly data for petroleum products this morning. Crude inventories rose to 426 million barrels this week, up 1.68 million from last week. While far from the highs of the past five years, this is only slightly above the five-year average for inventory levels. These numbers are in line with seasonal trends; oil inventories typically rise as refineries re-tool for winter product blends.
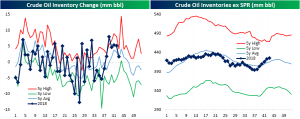
Strong demand from abroad paired with higher production has brought crude exports to their second-lowest deficit in the past five years. The smallest deficit actually came from earlier this month (10/5). Throughout this year, the deficit in crude exports has maintained a very low level relative to the last couple of decades.

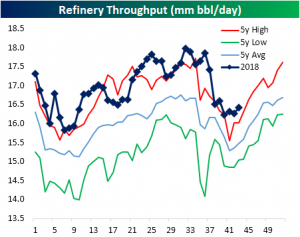
As shoulder season comes to a close, refinery demand has started moving back to more normal levels. Refinery throughput has been at elevated levels for most of the year, and is still high relative to the past five years, but is much closer to the average than where it has been.
B.I.G. Tips – November 2018 Seasonality
Fixed Income Weekly – 10/31/18
Searching for ways to better understand the fixed income space or looking for actionable ideals in this asset class? Bespoke’s Fixed Income Weekly provides an update on rates and credit every Wednesday. We start off with a fresh piece of analysis driven by what’s in the headlines or driving the market in a given week. We then provide charts of how US Treasury futures and rates are trading, before moving on to a summary of recent fixed income ETF performance, short-term interest rates including money market funds, and a trade idea. We summarize changes and recent developments for a variety of yield curves (UST, bund, Eurodollar, US breakeven inflation and Bespoke’s Global Yield Curve) before finishing with a review of recent UST yield curve changes, spread changes for major credit products and international bonds, and 1 year return profiles for a cross section of the fixed income world.
This week we review the longest drawdown in the bond market in over three decades.

Our Fixed Income Weekly helps investors stay on top of fixed income markets and gain new perspective on the developments in interest rates. You can sign up for a Bespoke research trial below to see this week’s report and everything else Bespoke publishes free for the next two weeks!
Click here and start a 14-day free trial to Bespoke Institutional to see our newest Fixed Income Weekly now!
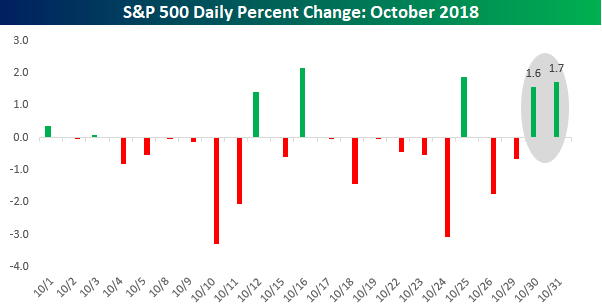
Back to Back Gains: Finally!
The market gods are taking it right down to the wire, but the S&P 500 looks like it’s finally going to have back to back positive days! Heading into Tuesday, the S&P 500 had only seen five up days during the entire month, and none of those daily gains came back to back with each other. Yesterday and today have been a different story, though, as the S&P 500 is not only on pace for back to back gains, but also back to back gains of more than 1.5%! The last time that happened was back in June 2016 just after the Brexit vote.
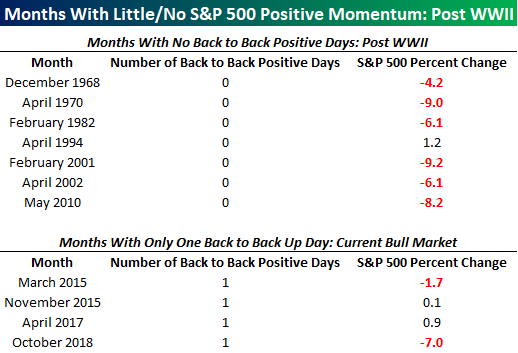
Even with back to back gains Tuesday and Wednesday, this month’s showing will still be weak, to say the least. Since the lows of the Financial Crisis in March 2009, October will go down as only the fifth month where the S&P 500 had only one or no instances of back to back gains in a given month. The last occurrence was a year and a half ago in April 2017, and surprisingly enough, the S&P 500 was actually up during that month! The other three instances were in March and November 2015, when there was just one instance of back to back daily gains, as well as May 2010 when the S&P 500 had no instances of back to back gains. May 2010 was also similar to this October because we saw the largest sell program this month since the Flash Crash back on 5/6/10. Finally, along with May 2010, there have only been six other months in the post-WWII period where an entire month passed without a single instance of back to back gains. Thankfully, it’s almost over!

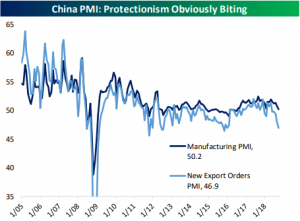
Tariffs Take Their Toll On China PMI
China released PMI data overnight, and the results seem to point towards further impacts from the trade US-China trade spat. The releases had been forecast to show declines, and the actual levels not only did that, but they also dropped more than expected. The manufacturing PMI is now sitting at 50.2—the lowest level since July. Services saw a steeper decline falling to 53.9 from 54.9, which is the lowest since August 2017. The biggest factor dragging down these numbers is new export orders. As protectionist tariffs have settled into place—this month was the first full month with the most recent round of tariffs in effect—export orders have declined. As it stands now, since 2005 there were only a few times that new export orders have been this weak: 7/08, 10/08-2/09, 12/11-1/12, 7/12-8/12, and 11/15. It will be interesting to see if this is reflected in hard data going forward given the large and growing US trade deficit with China.
Bespoke Consumer Pulse Report — October 2018
Bespoke’s Consumer Pulse Report is an analysis of a huge consumer survey that we run each month. Our goal with this survey is to track trends across the economic and financial landscape in the US. Using the results from our proprietary monthly survey, we dissect and analyze all of the data and publish the Consumer Pulse Report, which we sell access to on a subscription basis. Sign up for a 30-day free trial to our Bespoke Consumer Pulse subscription service. With a trial, you’ll get coverage of consumer electronics, social media, streaming media, retail, autos, and much more. The report also has numerous proprietary US economic data points that are extremely timely and useful for investors.
We’ve just released our most recent monthly report to Pulse subscribers, and it’s definitely worth the read if you’re curious about the health of the consumer in year two of Trump’s economy. Start a 30-day free trial for a full breakdown of all of our proprietary Pulse economic indicators.

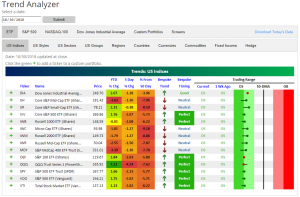
Trend Analyzer – 10/31/18 – Ways to Go
As shown in our Trend Analyzer snapshot below, even after 1%+ gains across the board yesterday, every major US index ETF that we track remains oversold (more than one standard deviation below its 50-DMA). Small-caps are the furthest below their 50-DMAs, while the Dow 30 ETF (DIA) is the closest to its 50-day at -3.96%. You can check up on sector and group ETFs along with individual US stocks at our Trend Analyzer page.