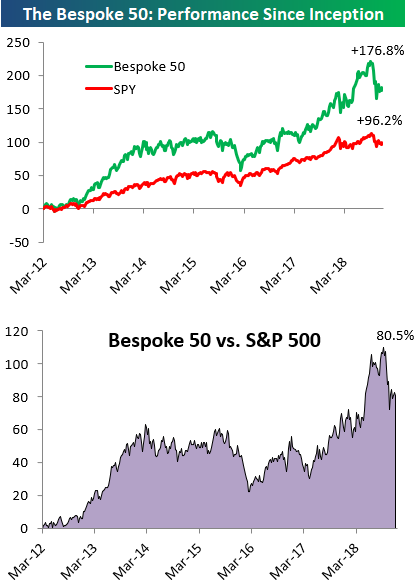
the Bespoke 50 — 12/6/18
Every Thursday, Bespoke publishes its “Bespoke 50” list of top growth stocks in the Russell 3,000. Our “Bespoke 50” portfolio is made up of the 50 stocks that fit a proprietary growth screen that we created a number of years ago. Since inception in early 2012, the “Bespoke 50” has beaten the S&P 500 by 80.5 percentage points. Through today, the “Bespoke 50” is up 176.8% since inception versus the S&P 500’s gain of 96.2%. Always remember, though, that past performance is no guarantee of future returns.
To view our “Bespoke 50” list of top growth stocks, click the button below and start a trial to either Bespoke Premium or Bespoke Institutional.
The Closer — Technical Selloff, Homebuilders The New Energy, Rates Positioning — 12/4/18
Log-in here if you’re a member with access to the Closer.
Looking for deeper insight on markets? In tonight’s Closer sent to Bespoke Institutional clients, we review the 5th 3% decline for the S&P 500 this year. Selling has been in large part a function of technicals, but there are deeper fears about the possibility of recession. We compare the current sector suffering (housing) to the oil market weakness of 2014-2016, which is a good example of markets and pundits confusing sector weakness for secular weakness. We also take a look at fixed income relative value and positioning to get more insight on the massive flattening and bond rally of the last two days.

See today’s post-market Closer and everything else Bespoke publishes by starting a 14-day free trial to Bespoke Institutional today!
Chart of the Day: Yield Curve, Yield Curve, Yield Curve
A Negative “Turnaround Tuesday”
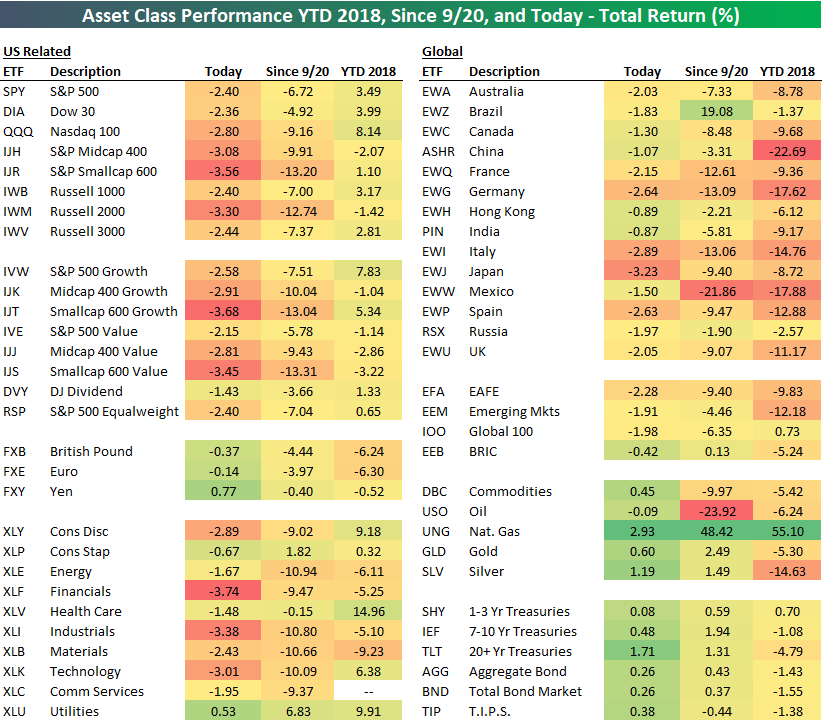
Monday’s 1.09% gain for the S&P 500 was the 19th time that December has started off with a 1%+ up day since 1928 when the index began. Unfortunately, all of yesterday’s gains and then some have been lost as of early afternoon today. Below is a quick look at the performance of various asset classes today using our key ETF matrix. We also include each ETF’s total return since the 9/20 peak for the S&P 500 as well as year-to-date.
As shown, major US index ETFs are down 2%+ across the board, with even more pain coming in the mid-cap and small-cap space. The S&P Smallcap 600 (IJR) is getting crushed by 3.56% as we type.
Looking at US sectors, the most pain is being felt in Financials (XLF), Industrials (XLI), and Technology (XLK), with all three down more than 3% on the day. The one sector that’s higher is Utilities (XLU), which benefits on days like today when risk-free interest rates are falling. The high-dividend yields of Utilities become more attractive as risk-free yields fall.
Outside of the US, Japan (EWJ) is getting hit the hardest with a drop of 3.23%. Germany (EWG), Italy (EWI), and Spain (EWP) are all down 2.6% or more as well. Hong Kong (EWH) and India (PIN) are down the least on the day with drops of roughly 90 bps.
The equity asset space is getting crushed today, but commodities and fixed income are performing well. The 20+ Year Treasury ETF (TLT) is up 1.71%, which is its best day since May 29th when it rose more than 2.19%.
Bespoke Stock Scores — 12/4/18
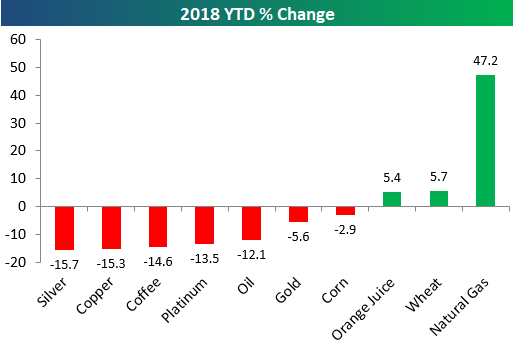
2018 Commodity Performance
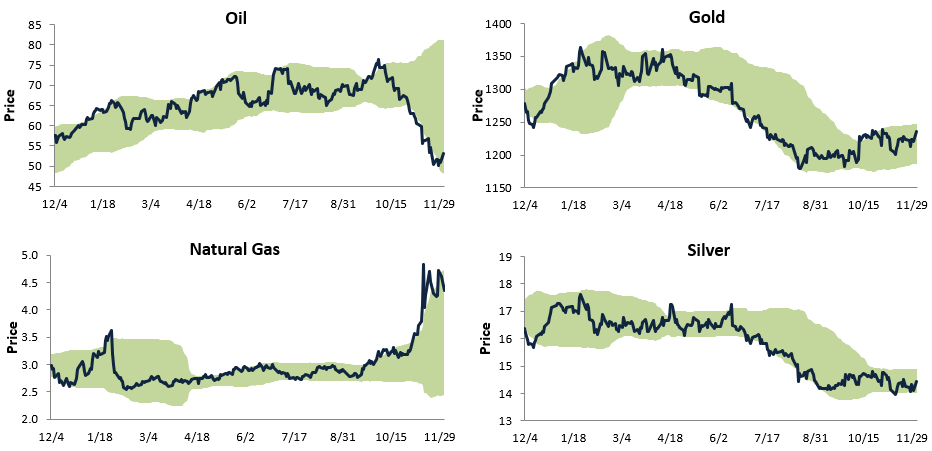
Below is a look at the 2018 YTD performance of major commodities. As shown, natural gas is up 47.2%, which is by far the biggest gainer of the bunch. Wheat and orange juice are the only other two commodities in the green on the year with gains of 5%+.
While corn and gold are down single-digit percentage points, the remaining five commodities in the chart are down more than 10%. Silver and copper lead the way lower with declines of 15%+, while coffee is down 14.6%, platinum is down 13.5%, and oil is down 12.1%.
Below are trading range charts for four of key commodities in the chart above — oil, gold, natural gas, and silver. The green shading in the chart represents between two standard deviations above and below the 50-day moving average. Moves to the top of this range are considered overbought, while moves to the bottom of the range are considered oversold.
Oil’s sharp decline from its highs a couple months ago has widened out its trading range dramatically, and it’s still trading right near the bottom of its range after a bounce over the last couple of days. To get back to overbought levels from here, oil needs to rally 50%!
Natural gas, on the other hand, is trading at the top of its trading range after experiencing a dramatic spike higher in November.
For the two precious metals, gold has started to trade positively lately after breaking out of its long-term downtrend with a series of higher lows over the last few months. The same can’t be said for silver, though, which hasn’t made as positive of a move as gold.
Morning Lineup – China Hopes Wear Off Fast
Well, that didn’t last long. The shelf life of news headlines these days is increasingly short, and the weekend’s positive trade headlines between the US and China are just another example. Less than 24 hours after a strong positive opening Monday morning, when we combine the decline off the highs yesterday and this morning’s weakness, US equities are on pace to give up 40% of their initial gains after the S&P 500 failed to make a higher high in its rally yesterday. Read today’s Bespoke Morning Lineup below for major macro and stock-specific news events, updated market internals, and detailed analysis and commentary:
Bespoke Morning Lineup – 12/4/18
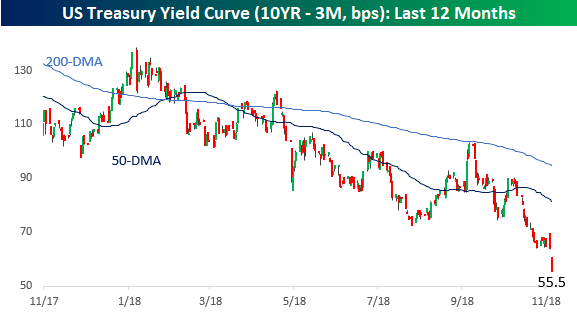
While the reported trade truce between the US and China over the weekend was supposed to remove a cloud of uncertainty over the economy, the yield curve (10yr vs 3m) didn’t seem to think so. While the curve steepened initially on Monday morning, it steadily flattened throughout the trading day and has continued to do so overnight and today. Today’s 8 bps flattening of the curve is the largest one day decline in over six months, and at the current level of 55 basis points, the curve is the flattest it has been since January 2008. While flat yield curves aren’t necessarily signs of economic weakness, they don’t suggest a whole lot of confidence in growth either.
Start a two-week free trial to Bespoke Premium to see today’s full Morning Lineup report. You’ll receive it in your inbox each morning an hour before the open to get your trading day started.

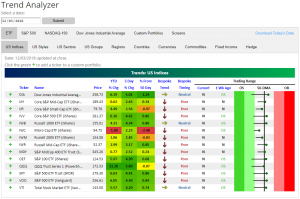
Trend Analyzer – 12/4/18 – Climbing 50-DMAs
Markets came roaring out of the gates this week, gapping up significantly higher yesterday. Fortunately, as we mentioned in a blog post yesterday, this gap up was all that was needed to lift 10 of the 14 US Index ETFs tracked in our Trend Analyzer tool above their 50-day moving averages. With the exception of the Micro-Cap ETF (IWC) which is still sitting significantly below its 50-DMA at -2.48%, even those that have not yet moved back above are within one percentage point of retaking the average. The Nasdaq (QQQ) is by far the closest sitting only 7 basis points below. Despite this, the overall picture is still not glaringly bullish as the majority of these names remain in longer-term downtrends. For the S&P 500, 2,800 is the resistance area that everyone is watching.
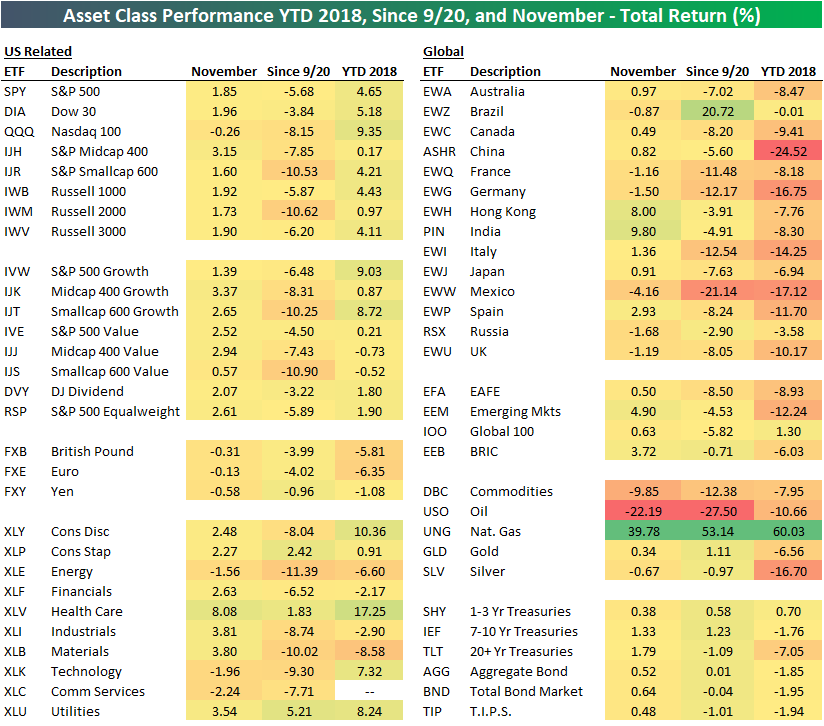
November 2018 Asset Class Total Returns
Below is a look at the performance of various asset classes in November using our key ETF matrix. Along with November total returns, we also include returns since the 9/20 high for the S&P 500 as well as year-to-date.
Both the S&P 500 (SPY) and the Dow 30 (DIA) gained just under 2% in November, while the Tech-heavy Nasdaq 100 (QQQ) finished in the red. The Technology (XLK), Energy (XLE), and Communication Services (XLC) sectors were all down in November, while Health Care (XLV) was up huge at +8%. With gains of 3.8%, Industrials (XLI) and Materials (XLB) were the next best performing sectors behind Health Care.
Outside of the US, the best performing countries were Hong Kong (EWH) and India (PIN) with gains of 8% and 9.8%, respectively. On the flip side, Mexico (EWW) was the worst performing country with a decline of 4.16%.
The real action in November came in the commodities space. The broad commodities ETF (DBC) fell 9.85% on the month, which was due to oil’s (USO) dramatic drop of 22.19%. Natural gas, on the other hand, caught a massive bid and gained 39.78% on the month! Nat gas is now up 60% on the year.
Treasury ETFs were slightly higher in November as rates pulled back a bit.