Bespoke’s Sector Snapshot — 1/10/19
S&P 500 Sector Performance — 2019 vs. 2018
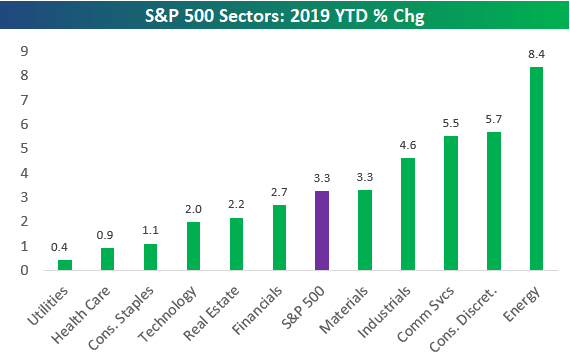
The S&P 500 was up 3.3% YTD as of mid-day today. As shown below, Energy has been by far the best sector so far this year with a gain of 8.4%. Consumer Discretionary ranks 2nd with a gain of 5.7%, followed closely by Communication Services in 3rd with a gain of 5.5%. Industrials and Materials are the other two sectors that have outperformed the S&P 500.
While all eleven sectors are in the black for the year, Utilities and Health Care have lagged the market with gains of less than 1%. Note that the Tech sector — the largest sector of the market — is up 2% YTD, which is 130 basis points less than the S&P 500.
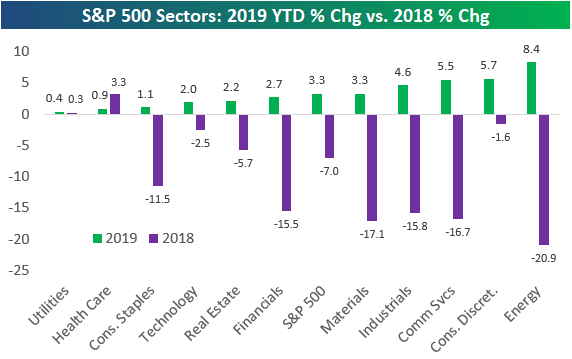
The chart below compares 2019 YTD performance with the change seen in 2018. Utilities and Health Care were the best performing sectors of 2018 and the only two sectors that were up on the year. These two sectors have taken a breather so far in 2019 as the weakest performers.
Generally speaking, the sectors that did the best in 2018 have underperformed so far this year, while the sectors that did the worst in 2018 have bounced the most. Energy was the worst sector of 2018 and is the best so far in 2019. The big exception is Consumer Discretionary, which only fell 1.6% for the full year 2018 and is up 5.7% in 2019 — good for second best so far this year.
B.I.G. Tips – Analysts Increasingly Pessimistic
the Bespoke 50 — 1/10/19
Every Thursday, Bespoke publishes its “Bespoke 50” list of top growth stocks in the Russell 3,000. Our “Bespoke 50” portfolio is made up of the 50 stocks that fit a proprietary growth screen that we created a number of years ago. Since inception in early 2012, the “Bespoke 50” has beaten the S&P 500 by 86.2 percentage points. Through today, the “Bespoke 50” is up 173.3% since inception versus the S&P 500’s gain of 87.1%. Always remember, though, that past performance is no guarantee of future returns.
To view our “Bespoke 50” list of top growth stocks, click the button below and start a trial to either Bespoke Premium or Bespoke Institutional.
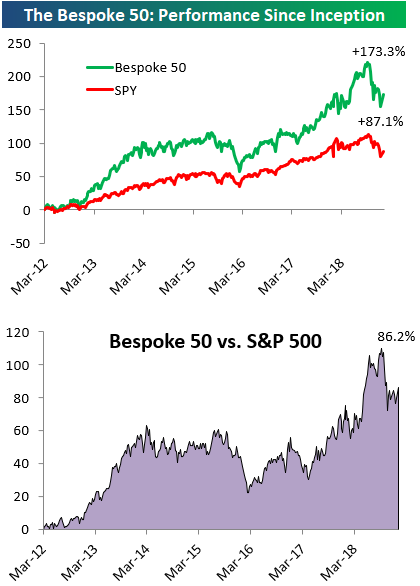
Chart of the Day: Homebuilders Looking Positive
Individual Investors Back To Normal
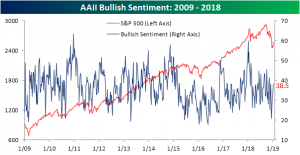
As equity prices have picked back up, so too has bullish sentiment. The survey of individual investors from AAII has seen a decent bounce in bullish sentiment back to more normal levels since hitting a multi-year low back in mid-December. This week’s survey saw 38.5% of investors reporting an optimistic outlook for markets in the next six months. That is right in line with the 38.5% historical average for the history of the survey.
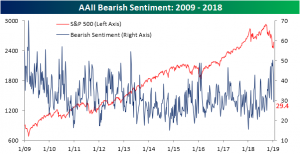
Conversely, bearish sentiment has seen a steep drop. The percentage of investors reporting a negative outlook fell by 13.4% to 29.4%. This measure has also more or less returned to normal levels. It is only around one percentage point lower than the historical average. One interesting point to make, bearish sentiment is currently at its lowest level since early October; right around the time that equities had peaked and took the turn downwards.
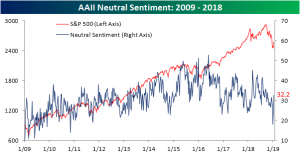
After reaching a remarkably low level only a couple weeks ago, neutral sentiment has picked back up significantly, settling—like the others—right around the historical average. This week, 32.2% of investors reported a neutral outlook, up from 24.2% last week. Though bullish sentiment has lifted, investors who were previously bearish have not necessarily turned bullish. A greater share of the declines in bearish sentiment seemed to have gone to the neutral camp.
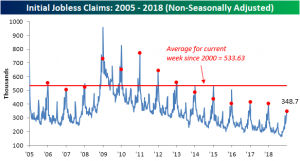
Jobless Claims Beat Expectations
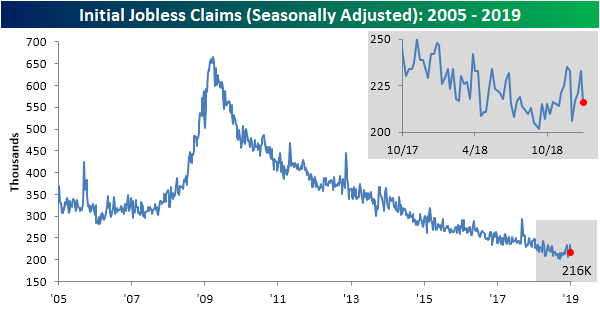
This week’s jobless claims data is piggybacking off the strong readings from Friday’s Nonfarm Payrolls report. Claims for the past week came in at 216K; well below last week’s revised 233K. Forecasts were calling for this drop, though claims were expected to come in 10K higher at 226K. This 216K reading is still off of lows from September but builds the streak of coming in at or under 250K to 66 weeks. This week also marked the 201st week with claims under 300K.
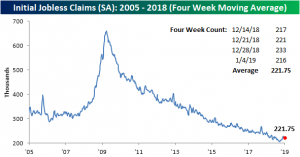
On a four-week moving average basis, claims saw a slight uptick as the low 206K reading from the first week of December has rolled off. The moving average currently sits at 221.75K (up from last week’s 219.25K). While still very low by historical standards, claims seem to have bottomed out some weeks ago, and on a shorter time horizon remain somewhat elevated.
Turning to the non-seasonally adjusted reading is perhaps the most impressive measure of this week’s data. Claims did in fact see a sizeable jump in line with seasonal patterns, but in spite of this rise, claims are still significantly lower than prior years in regards to the current week of the year. At 348.7K, non-seasonally adjusted claims are far below the 533.63K average dating back to 2000. If this week turns out to be the seasonal peak of the year, which is fairly likely based on historical trends, it is the best reading in years. There is still a chance claims can tick higher next week, but even if that uptick happens, this week’s reading only echoes last week’s Nonfarm Payrolls and showcases an enduring and historically hot labor market.
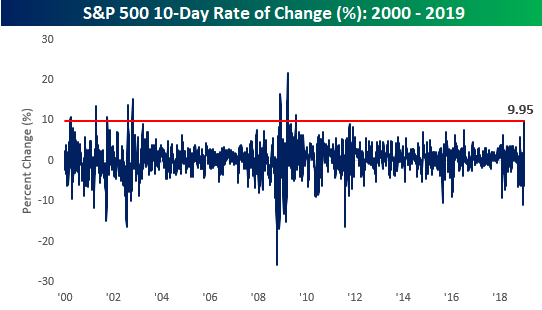
The End or the Beginning
An article on Bloomberg overnight highlighted the ‘historic’ nature of the S&P 500’s rally over the last 10-trading days as the biggest gain since 2009. The chart below shows the S&P 500’s 10-day rate of change going back to the start of 2000, and as you can see, there hasn’t been a larger gain over a similar span since March 2009. Anytime you start hearing comparisons to March 2009, it’s enough to get any bull excited as that kicked off what was the strongest bull market of all time.
When making market comparisons, though, it’s always important to keep perspective and not focus on just one data point. A perfect case in point is the example below. While it is true that the period in 2009 kicked off a period of exceptional market returns, back in the bear market from 2000, there were no less than five different periods where the S&P 500 saw larger moves over a ten-day span before the market could find a firm enough foundation to rally from.
Morning Lineup – We Can’t Go Up Every Day
We were bound to have at least one down day. After four straight days of gains and the biggest 10-day rally since 2009, futures are setting up to take a breather today. If equities can manage to turn things around following some very disappointing results from Macy’s that really will be impressive. Jobless Claims were just released and came in better than expected (216K vs 227K). Read today’s Bespoke Morning Lineup below for major macro and stock-specific news events, updated market internals, and commentary.
Bespoke Morning Lineup – 1/10/19

Start a two-week free trial to Bespoke Premium to see today’s full Morning Lineup report. You’ll receive it in your inbox each morning an hour before the open to get your trading day started.
