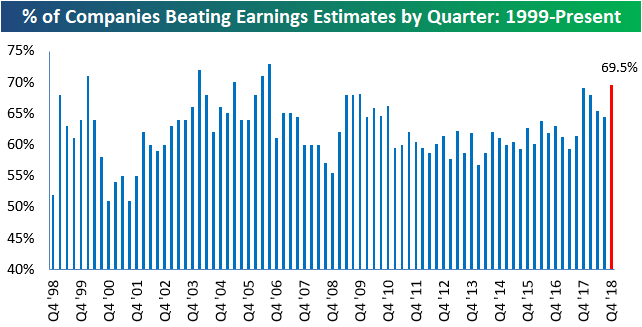
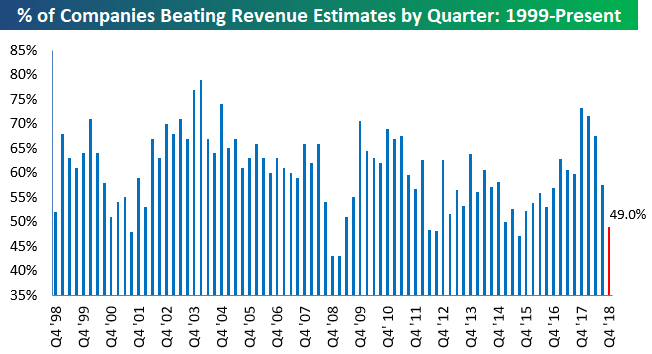
Tracking Revenue Beat Rates
It’s still very early in the Q4 earnings reporting period, but so far companies have been able to handily beat bottom-line EPS estimates. Where things aren’t looking so good is at the top line. We’re seeing a worrisome trend of revenue misses.
As shown in the top chart below, 69.5% of companies that have reported this season have beaten bottom-line EPS estimates. However, less than 50% of companies have beaten top-line revenue estimates (bottom chart). We’ll get a much better read on things this week when hundreds more companies are set to report, but early signs point to a huge struggle for companies to meet sales expectations in Q4. You can read more about the current earnings season in this week’s Bespoke Report newsletter, which is available with a two-week free trial to any membership level.
Bespoke Brunch Reads: 1/20/19
Welcome to Bespoke Brunch Reads — a linkfest of the favorite things we read over the past week. The links are mostly market related, but there are some other interesting subjects covered as well. We hope you enjoy the food for thought as a supplement to the research we provide you during the week.
While you’re here, join Bespoke Premium for 3 months for just $95 with our 2019 Annual Outlook special offer.
Lives Lived
John C. Bogle, Founder of Vanguard Group, Dies at 89 by Jason Zweig and Sarah Krouse (WSJ)
Near-zero cost access to index investing was a revolutionary idea in the 1970s when Vanguard’s first products were launched. Today, the ability to access equity markets and gain exposure to the market with no active selection is virtually free, mostly thanks to Bogle’s vision. [Link; paywall]
Weird News
Why every ski trail map looks the same by Katharine Schwab (Fast Company)
More than 250 trail maps for 175 mountains around the world have all been painted by the steady hands of James Neihues, the subject of a new coffee table book funded on Kickstarter. [Link]
100 years ago in Boston: The day molasses was deadly fast by William J. Kole (AP)
A century ago a giant storage tank in the bustling heart of New England burst, with more than 2.3mm gallons of molasses flowing through the streets at 35mph, killing more than 20. [Link]
Friends Don’t Let Friends Become Chinese Billionaires by Ray Kwong (Forbes)
In 2011 there were 115 billionaires in China. Since, 72 have died, with 15 murders, 17 suicides, 7 accidental deaths, and 19 from illness. Another 14 were executed. [Link]
Canadian air traffic controllers send pizzas to U.S. counterparts working without pay by Sarah Smellie (CBC)
Since 9/11, there’s been a special link between air traffic controllers monitoring the eastern approaches to North America from Europe and the busiest airport hub in the country (New York’s three airports). Amidst the US government shutdown, controllers in Atlantic Canada sent their counterparts a batch of pizzas to alleviate some of the pain of furloughs. [Link]
Attention Economy
Is having the most popular photo on Instagram worth anything? We’re about to find out. by Kurt Wagner (recode)
This week a single picture of a brown egg on Instagram became the service’s most-liked picture. While the effort to make the egg the most-liked picture is interesting, is it worth anything? [Link]
Investors Are Singing Along to ‘Baby Shark’ by Jacky Wong (WSJ)
For those not familiar, Baby Shark is an earworm nursery rhyme originating in Korea (link in case you’re not familiar) that has gotten a huge amount of play and the accompanying merchandising attention as well. [Link; paywall]
Tech Hardware
Taking the smarts out of smart TVs would make them more expensive by Nilay Patel (The Verge)
While it may sound counter-intuitive, smart TVs allow their manufacturers to also run content, advertising, and data businesses which lower the sticker price of their hardware. [Link]
As Carmakers Change Business Models, This Chip Firm Is Perfectly Positioned by Jon Markman (The Street)
Hyundai has introduced a new walking car, just one example of rapidly proliferating vehicle form factors with a range of attributes that Monolithic Power Systems (MPWR) can help enable, fueling the chipmakers’ business. [Link]
Recession Chatter
Yellen Warns Anecdotal Signs Show Businesses Putting a Pause on Spending by Anne Riley Moffat (Bloomberg)
In a somewhat unusual move for a recent Fed Chair, Yellen worried publicly about the path of Fed policy under Chair Powell, citing less synchronized global growth as a major risk. [Link; soft paywall]
Markets Take the Lead When It Comes to Factoring in Recession by Liz McCormick, Sarah Ponczek, and Molly Smith (Bloomberg)
Market moves into the end of last year (falling yields, flattening curve, falling equities, widening credit spreads) suggest a roughly 50% chance of a recession in the next year, though of course much of that rise in risk premiums have since reversed. [Link; soft paywall]
Shady Dealings
WeWork’s CEO Makes Millions as Landlord to WeWork by Eliot Brown (WSJ)
In what can’t be described as anything approaching arms’ length transactions, a series of building leases by WeWork came on buildings the CEO had an ownership stake in. [Link; paywall]
Sacklers Directed Efforts to Mislead Public About OxyContin, New Documents Indicate by Barry Meier (NYT)
New details in a court filing against the maker of OxyContin show that the Sackler family directed efforts to mislead the public about dangers of opiods. [Link; soft paywall]
Sports
A Must-See Gymnast, and the Meaning of Joy by Jason Gay (WSJ)
The floor routine of UCLA gymnast Katelyn Ohashi inspired, thrilled, and delighted the internet this week; the reason may be as simple as the pure joy of the routine. [Link; paywall]
ESPN’s Ex-President Wants to Build the Netflix of Sports by Ira Boudway (Bloomberg)
After resigning in the wake of a scandal involving substance abuse and the possibility of a sexual harassment allegation, John Skipper wants to bring on-demand streaming sports to the masses. [Link; soft paywall]
Taxes
Four former Fed chairs call for US carbon tax by Leslie Hook (FT)
27 Novel Laureates, 15 former CEA chairs, and 4 different former Fed Chairs have signed a letter urging the implementation of a carbon tax. Just as remarkable, the broad agreement across the economics profession has the support of companies like Shell, BP, and ConocoPhillips. [Link; paywall]
Middle-Class Growth Sparks Latest Surge in CT Tax Receipts by Keith M. Phaneuf (WestportNow)
Connecticut’s fiscal picture has improved rapidly of late as income tax receipts (typically driven by middle class households) have surged much more than estimated. [Link]
South Florida Mansion Sales Surge as Tax Exiles Seek Savings by Prashant Gopal & Jonathan Levin (Bloomberg Quint)
In response to state and local tax deduction caps in 2017’s tax reform bill, high income households are moving to Florida and bidding up real estate. [Link; soft paywall]
Policy Lab
Microsoft pledges $500 million to tackle housing crisis in Seattle, Eastside by Vernal Coleman and Mike Rosenberg (Seattle Times)
In an effort to combat the collapsing affordability of Seattle housing that Amazon and Microsoft have themselves contributed to, Microsoft unveiled a huge chunk of funding for new projects to ensure access to affordable housing. [Link]
A Failure to Adjust by Scott Lincicome (The Bulwark)
The argument against a so-called “China shock” being responsible for manufacturing job losses in the United States. [Link]
Security
The Super-Secure Quantum Cable Hiding in the Holland Tunnel by Jeremy Kahn (Bloomberg Quint)
Light’s combined wave and particle properties are used in a technology that insures taps on fiber optic cables can’t be run. [Link; soft paywall]
PnL
BNP Loses $80 Million on S&P 500-Linked Derivative Trades by Donal Griffin, Harry Wilson, and Alastair Marsh (Bloomberg)
The US equity market plunge in Q4 led to an $80mm loss in index derivatives for BNP Paribas’s New York-based trading unit. [Link; soft paywall, auto-playing video]
Crime
Is a Serial-Killer Gang Murdering Young Men Across the U.S.? by Nicole Weisensee Egan (The Daily Beast)
A group of retired detectives claims evidence exists linking 100-350 deaths. Per their investigations, they are murders conducted by an organized group of serial killers with cells in dozens of US cities. [Link]
Personal Data
The 773 Million Record “Collection #1” Data Breach (Troy Hunt)
A trove of email addresses and passwords with more than 2.6bn rows has hit the internet, assembled from a range of sources and posted for download on a file sharing site. [Link]
Judge unseals trove of internal Facebook documents following our legal action by Nathan Halverson (Reveal)
Children make for easy targets, and while in Facebook’s case the harm caused is only monetary, the social media company’s conduct resulted in huge credit card bills. New documents detailing the company’s policies are being unsealed. [Link]
Read Bespoke’s most actionable market research by joining Bespoke Premium today! Get started here.
Have a happy New Year!
The Bespoke Report — Call It A Comeback
2019 continues to track the complete opposite of what we saw in Q4 2018, with the hardest hit areas during Q4 bouncing the most off of their lows this year. Smallcaps are leading the way with gains of nearly 10% on the year, while Energy (XLE) leads all sectors at +11.32% on the back of oil’s (USO) 17% surge. Brazil (EWZ) leads all countries in our ETF matrix with a YTD gain of 13%, which is a rare continuation of what we saw for Brazil to end 2018. Canada (EWC) is also posting a solid showing in 2019 with a double-digit percentage gain already. The only areas of weakness are India (PIN), precious metals, and Treasuries.
For in-depth analysis of recent price action, sector technicals, earnings season, the economy, and more, start a two-week free trial to one of our three membership levels and read this week’s Bespoke Report newsletter. You won’t be disappointed!

The Closer: End of Week Charts — 1/18/19
Looking for deeper insight on global markets and economics? In tonight’s Closer sent to Bespoke clients, we recap weekly price action in major asset classes, update economic surprise index data for major economies, chart the weekly Commitment of Traders report from the CFTC, and provide our normal nightly update on ETF performance, volume and price movers, and the Bespoke Market Timing Model. We also take a look at the trend in various developed market FX markets.

The Closer is one of our most popular reports, and you can sign up for a free trial below to see it!
See tonight’s Closer by starting a two-week free trial to Bespoke Institutional now!
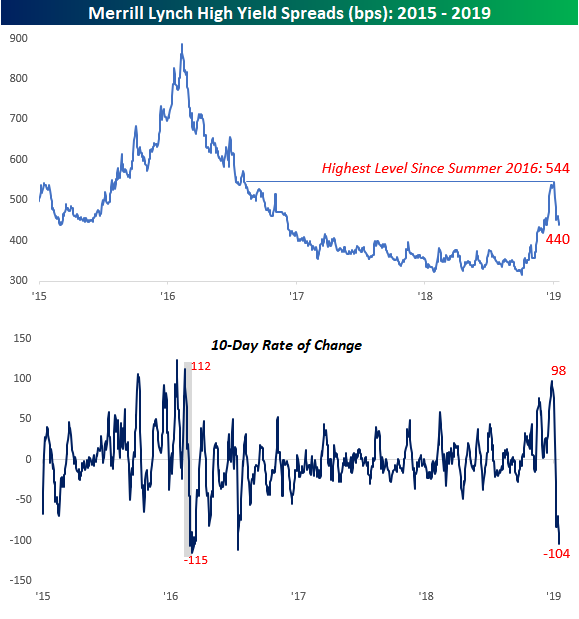
High Yield Spreads: When Crashing is a Good Thing
After screaming higher towards the end of 2018 right up through the first couple of days of 2019, high yield spreads have come crashing back down to earth in the last two weeks, falling from a high of 544 basis points (bps) on 1/3 to 440 bps through Thursday. At their highs two weeks ago, spreads were the widest they have been since the Summer of 2016 and the highest while moving higher since the middle of 2015 when oil prices were crashing.
In the lower chart, we show the 10-day rate of change of high yield spreads over time. At their peak back on 1/3, spreads had seen the largest 10-day move wider since early 2018 (98 bps). Ten trading days later, we are now looking at the largest narrowing move in spreads since July 2016. Unlike the current period, the narrowing of spreads in July 2016 did not immediately follow a 10-day move where spreads widened significantly. To find a period where this large of a move immediately followed a ten-day period where investors couldn’t exit high yield fast enough (wider spreads), you have to go back to that period in February 2016 that was marked by the ‘Dimon Bottom.” Now, if only the market follows a similar path moving forward!
Bespokecast Episode 28 — Kevin Muir — Now Available on iTunes, GooglePlay, Stitcher and More
 Our newest episode of Bespokecast is now available! Be sure to subscribe to Bespokecast on your preferred podcast app to gain access to our full collection of episodes. We’d also love for you to provide a review as well!
In this episode of Bespokecast, we sit down with Kevin Muir, the Market Strategist for Canadian investment management firm East West Management. In addition to a long experience in cash equities and derivatives working at Canadian banks, Kevin traded a personal portfolio for almost two decades, gaining wide experience across global markets. In his current role, he helps set strategy for East West’s portfolios and hedge funds. He also writes a free newsletter called The Macro Tourist, which serves as both a trading journal and exploration of issues facing global markets. In our conversation today, we talk about Kevin’s fascinating career path, the recent history and outlook for federal reserve policy, and modern monetary theory (MMT). Kevin offers some great perspectives that we hope investors of all types can learn from. You can follow Kevin on Twitter here.
To listen to our newest episode or subscribe to the podcast via iTunes, GooglePlay, OvercastFM, or Stitcher, please click the button or links below. Please note that third-party podcast feeds may update at a lag of a few hours to this blog post.

Morning Lineup – Rally Keeps Rolling
Despite denials from the Administration, US (and global) equities continue to rally this morning on optimism regarding a lifting of tariffs on Chinese imports. Read today’s Bespoke Morning Lineup below for major macro and stock-specific news events, updated market internals, and commentary.
Bespoke Morning Lineup – 1/18/19
While the S&P 500 is only just barely above its 50-day moving average, breadth, as measured by the 10-day A/D line, is near historic highs. As of yesterday’s close, the 10-day A/D line crossed above +2000 for just the fourth time since at least 1990 (there were no prior occurrences before 2005). Normally, we consider a reading of +1,000 to be strong, but +2,000 is really strong breadth. The fact that this historically strong reading came so soon after a historically weak reading suggests more than a hint on indecision on the part of investors.

Start a two-week free trial to Bespoke Premium to see today’s full Morning Lineup report. You’ll receive it in your inbox each morning an hour before the open to get your trading day started.
