Bespoke’s Sector Snapshot — Breadth Explosion — 1/31/19
We’ve just released our weekly Sector Snapshot report (see a sample here) for Bespoke Premium and Bespoke Institutional members. Please log-in here to view the report if you’re already a member. If you’re not yet a subscriber and would like to see the report, please start a two-week free trial to Bespoke Premium now.
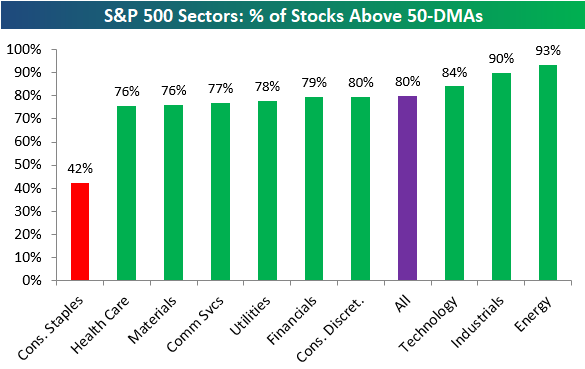
Below is one of the many charts included in this week’s Sector Snapshot, which shows the percentage of stocks trading above their 50-day moving averages by sector. Breadth readings have exploded higher this week, with 80% of S&P 500 stocks now trading above their 50-day moving averages. Ten of eleven sectors have more than 75% of stocks above their 50-DMAs, while Consumer Staples is the only sector with a reading below 50%.
To find out what this means and to see our full Sector Snapshot with additional commentary plus six pages of charts that include analysis of valuations, breadth, technicals, and relative strength, start a two-week free trial to our Bespoke Premium package now. Here’s a breakdown of the products you’ll receive.
B.I.G. Tips – Three Q4 Earnings Winners and a Few More Bullish Charts
In our newest B.I.G. Tips report available to Bespoke Premium or Bespoke Institutional subscribers, we feature three stocks that have history on their sides when it comes to reporting Q4 earnings in February. These are three of the best performing stocks in reaction to their Q4 earnings reports, and they have intriguing chart patterns as well. We also include charts of a few more stocks that look relatively bullish here based on our proprietary measures. To see the full report and find out which stocks we’re writing about, start a two-week free trial to Bespoke Premium or Bespoke Institutional now.

B.I.G. Tips – Death by Amazon – 1/31/19
Our “Death By Amazon” index was created many years ago to provide investors with a list of retailers we view as vulnerable to competition from e-commerce. In 2016, we also created our “Amazon Survivors” index which is made up of companies that look more capable of dealing with the threat from online shopping. To see how the two indices have been performing lately and view the full list of stocks that make up the indices, please read our newest report on the subject available to Bespoke Premium and Bespoke Institutional members.
To unlock our “Death By Amazon” and “Amazon Survivors” indices, login or start a two-week free trial to either Bespoke Premium or Bespoke Institutional.
Chart of the Day – February Intra-Month Performance
In today’s Chart of the Day available to Bespoke subscribers, we look at the historical performance of the S&P 500 during the month of February and its intra-month pattern going back to 1985. One interesting trend is how much January performance tends to impact February performance. To see the report, start a two-week free trial to any Bespoke membership level.
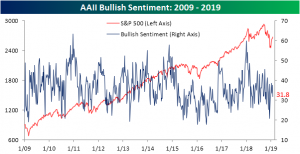
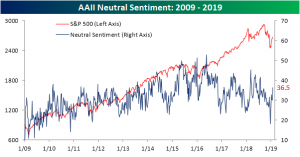
Bulls and Bears Get Even
Sentiment as seen through the AAII survey of individual investors was split evenly between the bulls and bears this week. After a week of the S&P 500 largely meandering sideways—with the exception of the surge yesterday—bullish sentiment dropped to 31.76% from 37.66% the prior week. While this drop is nothing substantial, bullish sentiment still sits firmly below the historical average of 38.5%.
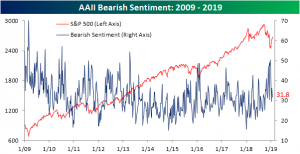
Bearish sentiment is dead even with bullish sentiment at 31.76%. That is slightly down from 32.32% last week. Since peaking in the first week of 2019, bearish sentiment has stayed within a low to mid 30% range. This week’s reading is at the lower end of that range for this year. Unlike bullish sentiment and in spite of the post-Christmas rally, this is actually still slightly above the historical average for bearish sentiment.
Meanwhile, neutral sentiment ticked up this week to the highest level since the first week of August of last year at 36.5%. Given these readings, investors seem to be increasingly cautious of the current rally. Although—as is the case following any Fed Day—we will have to wait until next week’s data to see the full impact of the Fed’s shift in tone and the subsequent market reaction to their meeting yesterday. The more dovish stance could help to boost bullish sentiment once again. It is also possible that neutral sentiment could drop back to more normal levels given increased clarity on the policy front.
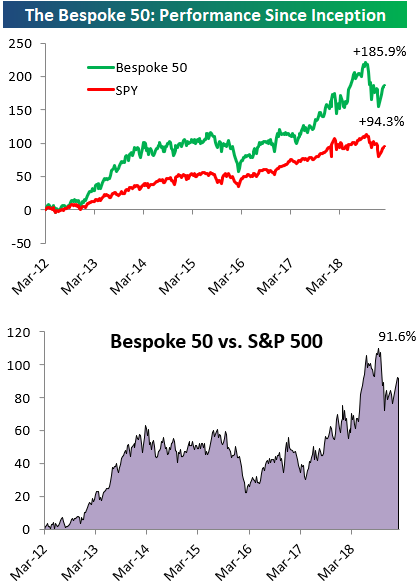
the Bespoke 50 — 1/31/19
Every Thursday, Bespoke publishes its “Bespoke 50” list of top growth stocks in the Russell 3,000. Our “Bespoke 50” portfolio is made up of the 50 stocks that fit a proprietary growth screen that we created a number of years ago. Since inception in early 2012, the “Bespoke 50” has beaten the S&P 500 by 91.6 percentage points. Through today, the “Bespoke 50” is up 185.9% since inception versus the S&P 500’s gain of 94.3%. Always remember, though, that past performance is no guarantee of future returns.
To view our “Bespoke 50” list of top growth stocks, click the button below and start a trial to either Bespoke Premium or Bespoke Institutional.
The Streak Ends for Jobless Claims
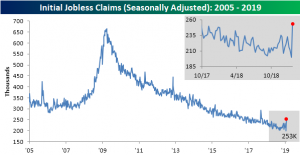
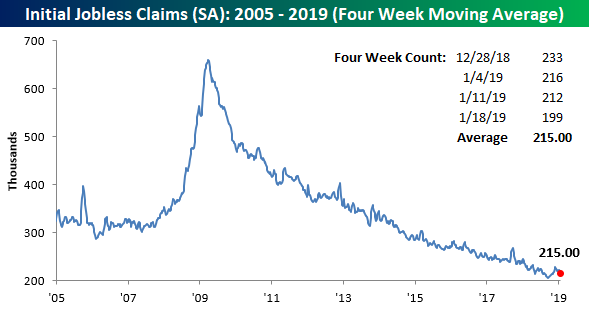
This morning’s release of Initial Jobless Claims seems to have made an about-face from the impressively strong reading of 199K seen last week. On a seasonally adjusted basis, claims for this week not only went back above 200K but skyrocketed all the way to 253K; their highest level since September 2017. This week’s number also far surpasses the recent jumps seen in October and November of last year when they rose to around 230K. This spike in claims brings an end to the streak of 68 weeks with the seasonally adjusted number coming in below 250K. That was the longest streak since the 89-week streak that ended in January of 1970. Granted, the indicator still has 47K of insurance in its streak of remaining under 300K. That streak is now at 204 weeks long, so while this week’s data raises an eyebrow, it still maintains a healthy level.
Give the large spike in claims, the four-week moving average also rose with a 5K uptick this week to 220.25K. That is right back in line to where the moving average was back in November and December. With the large reading from this week staying in as an input to the average, it will likely remain somewhat elevated for the time being.
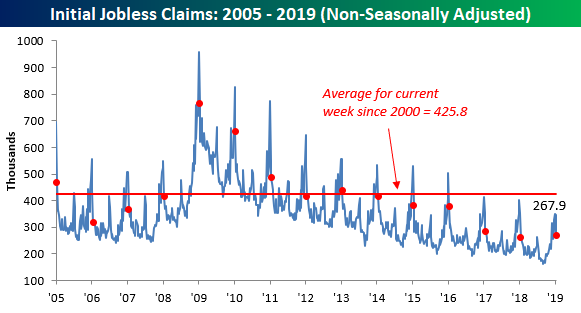
Turning to the non-seasonally adjusted (NSA) data, believe it or not, claims actually fell by almost 20K. The NSA number for this week was 250.2K versus 269.8K last week. Once again, that is well below the average for the current week since 2000 and the lowest reading for the current week in that same timeframe. While the seasonally adjusted number may have come in exceptionally high, labor markets still seem healthy through this non-seasonally adjusted number. The large divergence between the SA and NSA data could very well come as a result of certain quirks in the SA calculations. Also important to note, the government shutdown should not play too large of a role in these readings as government workers are supposed to apply for jobless benefits through other programs, meaning they would more than likely not be counted in these initial jobless claims numbers (although contractors impacted by the shutdown may have started to show in the numbers)
Morning Lineup – Jobless Claims Surge
After the FOMC came through in a big way for the bulls yesterday, equity futures are quiet this morning. Over in the Nasdaq, things are looking brighter as an 11% rally in Facebook (FB) following its earnings report last night has the stock on pace for its best earnings reaction day in three years! In more global macro data, the President is busy on Twitter this morning discussing the topic of Chinese trade and saying that no deal will be made until he personally meets with Chinese President Xi in the “near future.” Jobless Claims were just released and saying they surged would be an understatement, as they rose from 200K up to 253K, the highest weekly reading since September 2017! Read today’s Bespoke Morning Lineup for more on what’s driving the markets this morning.
Bespoke Morning Lineup – 1/31/19
It wasn’t long ago that the market would seemingly go months on end without a daily move of 1% let alone 2%. With the help of the Fed’s dovish turn yesterday, though, the Nasdaq rallied over 2%, making it the 24th time in the last 100 trading days that the index moved up or down 2% in a single day. That works out to an average of more than once a week!
The chart below shows the historical 100-day rolling total of occurrences where the Nasdaq saw an up or down move of 2%+. The current level of 24 is now the highest total we have seen since early 2012, and only the fourth such period in the index’s history. Granted, the period in the late 1990s/early 2000s lasted a long time and saw a much higher frequency of 2% at its most extreme points, but these periods of large day to day moves are still relatively uncommon. Just as interesting is how the period from 1972 through the mid-1990s saw so little in the way of big daily moves. But once the late 1990s rolled around, the beast was awoken.

Start a two-week free trial to Bespoke Premium to see today’s full Morning Lineup report. You’ll receive it in your inbox each morning an hour before the open to get your trading day started.

Chart of the Day: Big Fed Up Days
In today’s Chart of the Day available to Bespoke subscribers, we look at the historical performance of the S&P 500 in the days and weeks after the index experiences a gain of more than 1% on Fed Days. With the S&P 500 trading up 1.5% with 30 minutes left in the trading day, it’s looking like this analysis will be very applicable after the close. To see how the market performs after big Fed up days, start a two-week free trial to any Bespoke membership level.