US Retail Sales Still Better Than Most
Last week, Retail Sales raised eyebrows as the December release came in with a horrendous print. Taking a step back and looking at sales from a global scale, though, US retail sales are still fairly strong compared to the other 23 major economies that we track through our Global Macro Dashboard. With a y/y growth rate of 2.3%, the indicator has a little bit of headroom above the average global rate of 2.16% and a full percentage point above the median global growth rate. In other words, while the December print wasn’t great—reasons to be suspect of the most recent data (see here and here) aside—and the indicator has been trending downwards in recent months, US Retail Sales are growing at a faster rate than 14 of the 23 global economies in our Dashboard. Of the developed economies tracked, the US actually has the fourth fastest growing retail sales behind the UK, France, and Australia, while the rest of the countries with faster growth are all emerging markets. Meanwhile, 5 of the countries in our Dashboard have actually seen contractions in their most recent y/y retail sales reading.
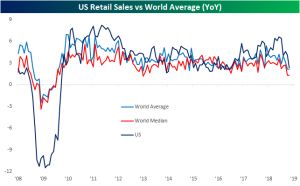
Chart of the Day: After Hours vs. Open to Close by Weekday
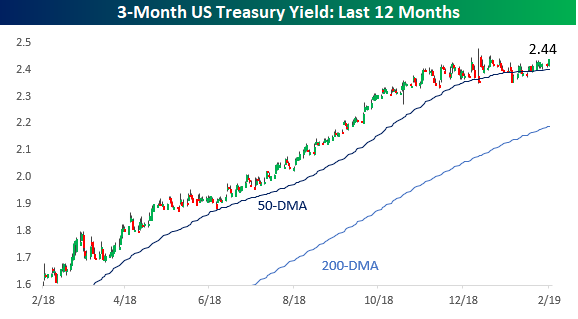
Treasury Yields Keep Drifting Lower
Despite continuing calls for a move higher in rates, US Treasury yields have been flat to lower across the curve recently. Let’s start with the short end of the curve. While you could practically set your watch to the pace of rising yields on the 3-month UST for most of 2018, the rise came to a halt late in Q4 as economic data slowed and the equity market declined. Last month’s pivot by the FOMC to pause its rate hiking cycle has only reinforced that trend. For now, 2.5% should be a ceiling.
At the long end of the curve, yields have not only not been rising, but they’ve also been falling. When equity markets bottomed in late 2018, the yield on the 10-year briefly started rising again, but that move higher in yields came to a halt just shy of 2.8%, which had formerly been a support level. As things stand now, the 10-year yield is at 2.65% and not far from one-year lows.

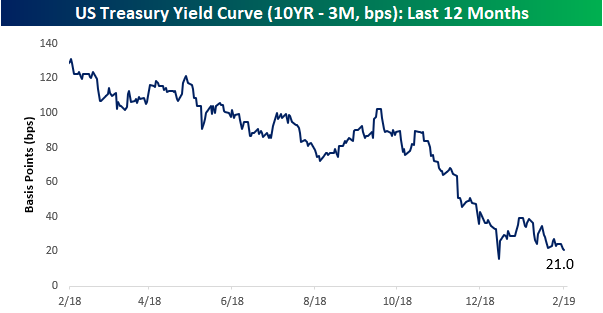
With lower yields at the longer end of the curve, the yield curve (10-year minus 3-month yield) has been flattening dramatically again. At today’s level, the yield curve is barely legal to drink and outside that brief period at the end of last year is at its lowest levels in over a decade. What will it take to get the curve steepening again?
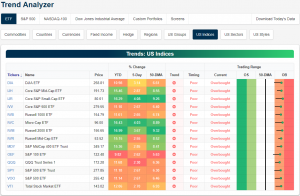
Trend Analyzer – 2/20/19 – S&P 100 (OEF) Gets Left Behind
Every major index ETF remains overbought headed into the open. Small caps continue to lead the group with the Core S&P Small Cap (IJR) having risen the most over the past week at 4.08%. The Micro-Cap (IWC) is right on IJR’s heels with a gain of 4.03%. Both ETFs are also the most overbought and among the highest above their 50-DMAs (IWM Russell 2000 is the highest above its moving average). On the other hand, large caps have continued to lag behind their smaller peers as they have much of the year. While gains over the past week have been somewhat middling, the S&P 100 (OEF) is currently the only index to not have seen double-digit gains since the start of the year. The other large-cap index, the Dow (DIA), has managed to edge out returns more in line with the other major indices at 10.98% YTD.
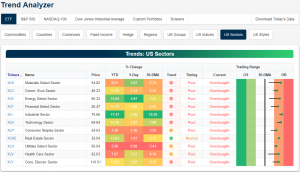
Looking at the 11 sectors of the economy, every ETF tracking the individual sectors is now also overbought. This time last week, a number of these sectors were still neutral. Industrials (XLI) is currently the most overbought as it sits 10.2% above its 50-DMA. XLI has also seen the best returns gaining 17.47% YTD. As the best performer over the past week (+5%), Energy (XLE) is next in line in YTD terms adding 15.64%. A major positive development to note when looking at the sectors is that in the past month, trends have begun to reverse whereas every sector was firmly in a downtrend at the beginning of the year. Real Estate (XRE) is currently the only one in an uptrend. Three others (XLP, XLU, and XLV) are now trending sideways.
Bespoke’s Global Macro Dashboard — 2/20/19
Bespoke’s Global Macro Dashboard is a high-level summary of 22 major economies from around the world. For each country, we provide charts of local equity market prices, relative performance versus global equities, price to earnings ratios, dividend yields, economic growth, unemployment, retail sales and industrial production growth, inflation, money supply, spot FX performance versus the dollar, policy rate, and ten year local government bond yield interest rates. The report is intended as a tool for both reference and idea generation. It’s clients’ first stop for basic background info on how a given economy is performing, and what issues are driving the narrative for that economy. The dashboard helps you get up to speed on and keep track of the basics for the most important economies around the world, informing starting points for further research and risk management. It’s published weekly every Wednesday at the Bespoke Institutional membership level.
You can access our Global Macro Dashboard by starting a 14-day free trial to Bespoke Institutional now!

Morning Lineup – All Quiet Ahead of FOMC Minutes
Earnings season just ended yesterday, but things are already pretty quiet in terms of news today, and the futures reflect that with levels suggesting just a slightly negative open. Besides weekly mortgage applications which were released earlier, the only release of importance today is the FOMC Minutes from the January meeting. Read all about overnight events around the world and this morning’s news in today’s Morning Lineup.
Bespoke Morning Lineup – 2/20/19
On the subject of today’s FOMC Minutes, it will be interesting to read about the Committee’s discussion and the ultimate decision to pivot on rate policy. In terms of the market’s expectations for future rate policy this year, it is hard to believe that market pricing for a rate cut between now and the December meeting is still significantly higher than the odds of a hike. At just a 1% probability, market expectations for a rate hike are pretty much non-existent.

Start a two-week free trial to Bespoke Premium to see today’s full Morning Lineup report. You’ll receive it in your inbox each morning an hour before the open to get your trading day started.

The Closer — Bentonville Boom — 2/19/19
Log-in here if you’re a member with access to the Closer.
Looking for deeper insight on markets? In tonight’s Closer sent to Bespoke Institutional clients, with Walmart’s strong Q4 report helping to alleviate some concerns over the US consumer, we take a look at what this means for the stock going forward as well as the economic implications. Turing to economic data, we evaluate the strength in Homebuilder Sentiment as seen through the National Association of Homebuilders’ index released this morning. After reviewing more soft data from the NY Fed’s Business Leader’s survey, we look at how various breadth levels have continued to support strong price action. We end tonight with a note on the compression of the US dollar’s trading range and the potential for a big breakout in the buck.

See today’s post-market Closer and everything else Bespoke publishes by starting a 14-day free trial to Bespoke Institutional today!
30 Stocks Furthest Above and Below 50-DMAs
As the S&P 500 continues to rally off of its Christmas Eve low, many stocks have extended well past their 50-day moving averages. Below is a list of the 30 S&P 500 stocks that are trading the furthest above their 50-DMAs. At the top of the list is Coty (COTY) which currently sits 44.18% above its 50-DMA. Before reporting earnings on February 8th, the stock actually sat just below its moving average, but a strong report rocketed the stock well above its 50 and 200-day. While no other stocks are quite as overextended as COTY, there are currently nine that sit more than 20% above their 50-DMAs. Many of these saw a strong Q4 earnings report, like Xilinx (XLNX) which reported a triple play and gapped up 9.55% in reaction to the news. Other notables on the list of most extended stocks include Chipotle (CMG), Electronic Arts (EA), Advanced Micro (AMD), Boeing (BA), Netflix (NFLX), and General Electric (GE).
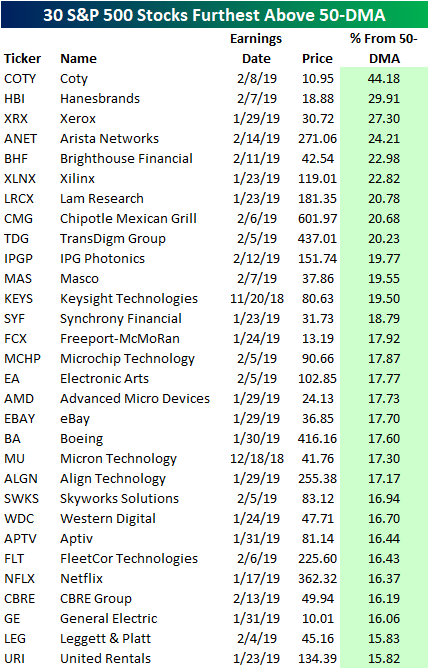
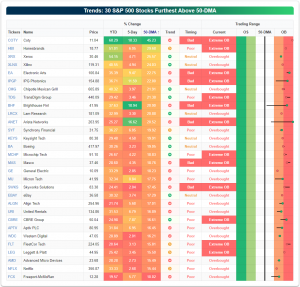
While these stocks have performed unbelievably lately, they are now reaching extremely overbought levels as shown through our popular Trend Analyzer tool. A couple like COTY and ANET have extended so far above their 50-DMAs that they are basically off the chart. As a result of these readings, many of these stocks have poor timing ratings as they are increasingly overdue for some downside mean reversion.
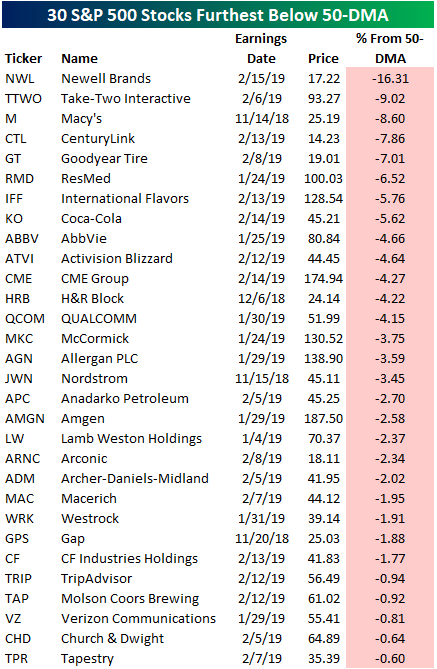
At the other end of the spectrum, below we show the 30 S&P 500 stocks that are furthest below their 50-DMAs. Newell Brands (NWL) is the leader of the group at 16.31% below. NWL plummeted over 9% on Friday after lowering guidance, whereas before reporting it comfortably sat above its 50-DMA. It has continued to decline today. The next stock that is far below its 50-DMA is Take-Two Interactive (TTWO) which also saw a sour response to earnings a couple weeks ago. This stock is another that actually sat above its 50-DMA before its earnings report was released. A similar name, Activision Blizzard (ATVI), joins TTWO on this list despite their peer EA being one of the most elevated stocks.
Note that there is just one stock in the S&P 500 that is more than 10% below its 50-day, while there are 30+ that are more than 15% above their 50-days!
B.I.G. Tips – Top Earnings Triple Plays
Here at Bespoke, our job is to identify winners and losers, and one of the ways we try to find earnings-season winners is through our list of “triple plays.”
Long-term Bespoke subscribers know how much we like triple plays, but for those that haven’t heard of the term, we came up with it back in the mid-2000s for companies that beat analyst EPS estimates, beat analyst revenue estimates and also raise guidance. Investopedia.com is one of the best online resources for financial markets education, and they’ve given us credit for coining the “triple play” term on their website. We consider triple play stocks to be the cream of the crop of earnings season, and we are constantly finding new long-term buy opportunities from this basket of names each quarter.
This earnings season (Q4 2018) there were just 54 triple plays. In the Q4 2017 reporting period a year ago, there were more than 130. Throughout earnings season, Bespoke Premium and Institutional members have access to our Earnings Triple Plays page, which keeps a running tally of the 100 most recent triple plays. We also publish our Top Triple Plays Report, which filters the list of most recent triple plays down to the ones with the most attractive chart patterns. We’ve just published our newest Top Triple Plays Report featuring 10 stocks with chart patterns that we like. Learn how to see the stocks below!
See our Top Earnings Season Triple Plays by signing up for a Bespoke Interactive membership now. Click this link for a 60-day free trial!
