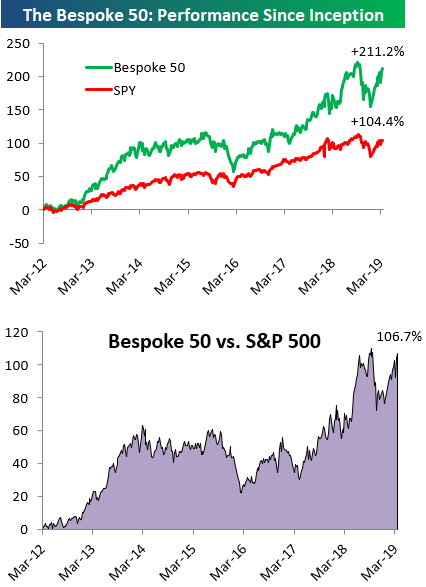
the Bespoke 50 — 3/21/19
Every Thursday, Bespoke publishes its “Bespoke 50” list of top growth stocks in the Russell 3,000. Our “Bespoke 50” portfolio is made up of the 50 stocks that fit a proprietary growth screen that we created a number of years ago. Since inception in early 2012, the “Bespoke 50” has beaten the S&P 500 by 106.7 percentage points. Through today, the “Bespoke 50” is up 211.2% since inception versus the S&P 500’s gain of 104.4%. Always remember, though, that past performance is no guarantee of future returns.
To view our “Bespoke 50” list of top growth stocks, click the button below and start a trial to either Bespoke Premium or Bespoke Institutional.
The Closer — Doves Not Done Yet — 3/20/19
Log-in here if you’re a member with access to the Closer.
Looking for deeper insight on markets? In tonight’s Closer sent to Bespoke Institutional clients, as the Fed came out with an increasingly dovish tone today, cutting rate hike estimates to zero for the rest of 2019, lowering growth expectations, and announcing a stop to asset purchases within the year, we provide a summary to the market’s reaction. Next, we delve a bit deeper into the Fed’s summary of economic projections (SEP), which using the Taylor Rule, backs up their policy decisions to keep rates neutral. Then we cover weekly fund flows which continued to see equity outflows as there were massive inflows into bonds. We finish with an updated look at EIA’s big increase in petroleum inventories.

See today’s post-market Closer and everything else Bespoke publishes by starting a 14-day free trial to Bespoke Institutional today!
Equity Fund Outflows Continue
This week’s fund flows from the Investment Company Institute showed an ongoing desire to reduce equity exposure from mutual fund investors. As shown below, domestic, international, and total equity fund categories have seen outflows over the last week, month, quarter, and year. All categories of domestic equity funds have seen net outflows over the past week, month, quarter, and year as well, while EM equities are the only sliver of inflows. It’s the complete opposite for bonds, where inflows have been enormous, including record inflows to mutual funds owning municipal bonds and strong government bond fund inflows.
For weekly updates of fund flows, join Bespoke Institutional now with a two-week free trial.
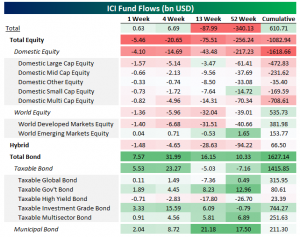
Chart of the Day: Single Digit Yield Curve
Fixed Income Weekly – 3/20/19
Searching for ways to better understand the fixed income space or looking for actionable ideals in this asset class? Bespoke’s Fixed Income Weekly provides an update on rates and credit every Wednesday. We start off with a fresh piece of analysis driven by what’s in the headlines or driving the market in a given week. We then provide charts of how US Treasury futures and rates are trading, before moving on to a summary of recent fixed income ETF performance, short-term interest rates including money market funds, and a trade idea. We summarize changes and recent developments for a variety of yield curves (UST, bund, Eurodollar, US breakeven inflation and Bespoke’s Global Yield Curve) before finishing with a review of recent UST yield curve changes, spread changes for major credit products and international bonds, and 1 year return profiles for a cross section of the fixed income world.
In this week’s report we discusses the unusual term structure of US interest rates at the front of the curve, relative to the rest of the world.

Our Fixed Income Weekly helps investors stay on top of fixed income markets and gain new perspective on the developments in interest rates. You can sign up for a Bespoke research trial below to see this week’s report and everything else Bespoke publishes free for the next two weeks!
Click here and start a 14-day free trial to Bespoke Institutional to see our newest Fixed Income Weekly now!
FOMC: Fishing, Hiking, or Whitewater Rafting?
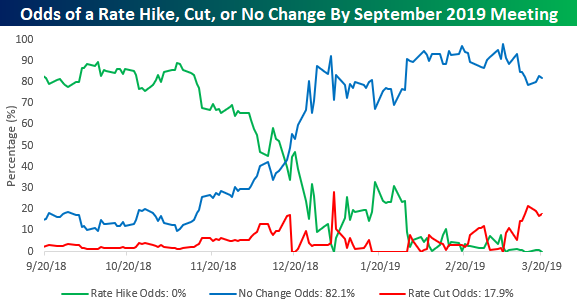
With the FOMC wrapping up its two-day policy meeting today and the market pricing in as near a certainty as it can that there will be no change in rates, the committee is either gearing up for a big surprise to the markets when it releases its 2PM statement today or doing a whole lot of nothing trying to fill the time. Not only today, but for the next several meetings, market expectations for Fed policy anticipate little in the way of movement for the Fed Funds rate. The market is currently pricing in no chance of a rate hike between now and the September meeting and an 18% chance of a rate cut. If the market is right (which isn’t always the case), the FOMC will have to find things to do to fill the time at the next few meetings. Maybe they can nail down plans for the late August KC Fed Jackson Hole Economic Policy Symposium. While there’s obviously no skiing in August, it’s hard to match the fishing, hiking, and whitewater rafting at that time of year!
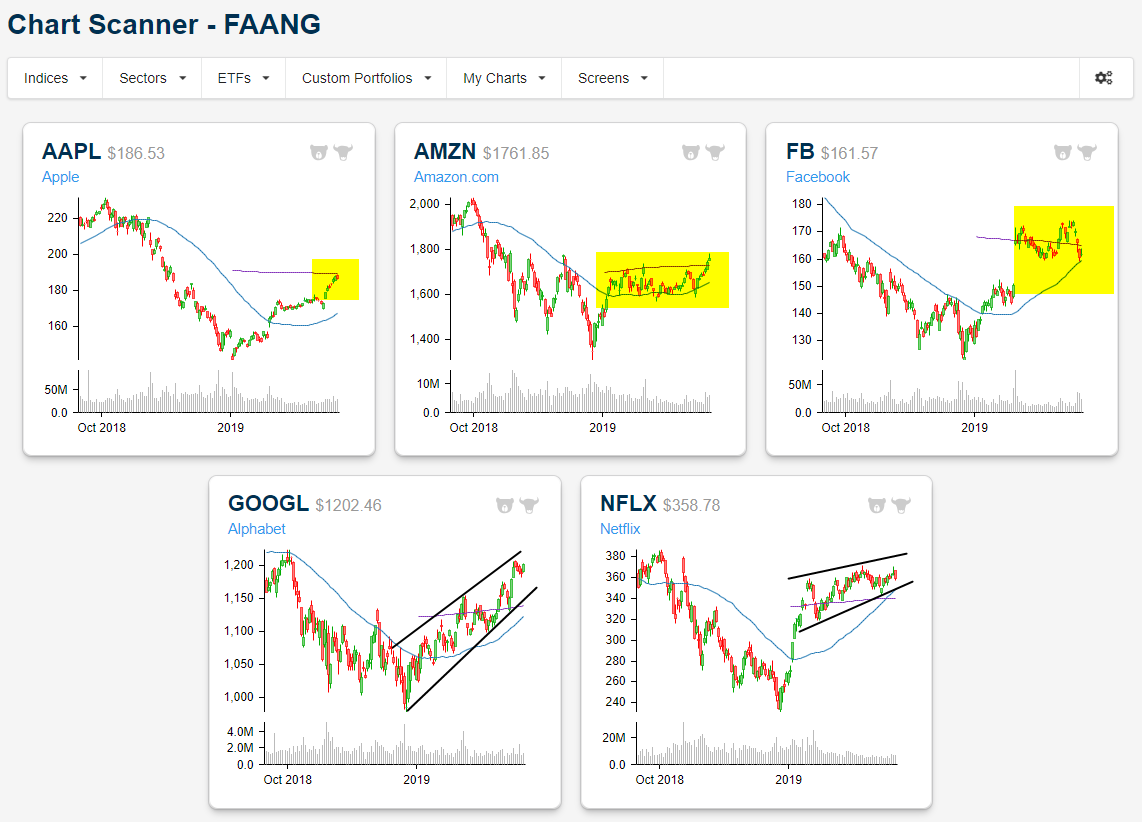
FAANG Chart Update
Below is a snapshot of the five FAANG price charts from our Chart Scanner tool that’s available to Bespoke Premium and Bespoke Institutional members. Each stock has its own unique set up right now.
Apple (AAPL) has gone from $140 to $185 in less than 3 months, but the move still hasn’t pushed the stock above resistance at its 200-day moving average. Traders will be watching AAPL closely over the next few days ahead of next week’s product event to see if this resistance can be broken.
Amazon (AMZN) had been trading in a tight sideways range since early 2019, but gains this week have finally caused shares to break out of this range to the upside. That’s a bullish move.
Facebook (FB) has gone in the opposite direction as AMZN over the last five trading days, breaking below its 200-day moving average and testing support at its 50-day moving average. So far the 50-day has held for FB.
Alphabet (GOOGL) has made a series of higher highs and higher lows since the end of 2018, and gains over the last week have pushed the stock up near six-month highs. The stock is currently trading right at $1,200/share, and it needs another $100 to test all-time highs made in mid-2018.
Finally, Netflix (NFLX) shares shot out of the gate at the start of the post-Christmas rally, but the stock has been consolidating in a relatively tight range over the last couple of months with a slight bias higher. It looks like NFLX will probably remain in this range until it reports earnings on April 16th. As one of the most volatile stocks on earnings in the entire US market, chances are the stock will break out of its tight range either to the upside or the downside following its next earnings report.
Start using our popular Chart Scanner tool now with a two-week free trial to Bespoke Premium!
BRICs Build on Gains
Below is a snapshot of the four BRIC country ETFs from our Chart Scanner tool that’s available to Bespoke Premium and Bespoke Institutional members. As you can see, all four countries have been trending higher this year, with China (ASHR) and India (PIN) experiencing the sharpest moves. Both are currently very extended above their moving averages, and investors will be watching whether they can hold above support within their long-term uptrend channels when the inevitable mean reversion occurs.
Brazil (EWZ) is also in a nice long-term uptrend with a series of higher highs and higher lows being made over the last six months. EWZ is not nearly as extended to the upside as ASHR or PIN, so for someone looking to enter into these markets, Brazil looks more attractive right now. Russia (RSX) struggled a bit in early March, but it has seen a huge gain over the last few trading days to put it back up near six-month highs.
Start using our popular Chart Scanner tool now with a two-week free trial to Bespoke Premium!

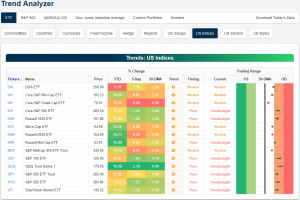
Trend Analyzer – 3/20/19 – Nasdaq Leads
Below is a snapshot of US index ETFs pulled from our popular Trend Analyzer tool. Every ETF listed is up more than 10% YTD, and every one is above its 50-day moving average as well. Our proprietary “Trend” rating shows that they’re all in sideways trends, but they should start to flip to uptrends if the market can push a little higher over the next couple of weeks.
Right now, the Nasdaq 100 ETF (QQQ) is the most overbought of the bunch, followed by the large-cap S&P 100 (OEF). The Core S&P Small-Cap ETF (IJR) is the closest to its 50-day moving average.
Bespoke’s Global Macro Dashboard — 3/20/19
Bespoke’s Global Macro Dashboard is a high-level summary of 22 major economies from around the world. For each country, we provide charts of local equity market prices, relative performance versus global equities, price to earnings ratios, dividend yields, economic growth, unemployment, retail sales and industrial production growth, inflation, money supply, spot FX performance versus the dollar, policy rate, and ten year local government bond yield interest rates. The report is intended as a tool for both reference and idea generation. It’s clients’ first stop for basic background info on how a given economy is performing, and what issues are driving the narrative for that economy. The dashboard helps you get up to speed on and keep track of the basics for the most important economies around the world, informing starting points for further research and risk management. It’s published weekly every Wednesday at the Bespoke Institutional membership level.
You can access our Global Macro Dashboard by starting a 14-day free trial to Bespoke Institutional now!
