Bespoke’s Sector Snapshot — 4/11/19
We’ve just released our weekly Sector Snapshot report (see a sample here) for Bespoke Premium and Bespoke Institutional members. Please log-in here to view the report if you’re already a member. If you’re not yet a subscriber and would like to see the report, please start a two-week free trial to Bespoke Premium now.
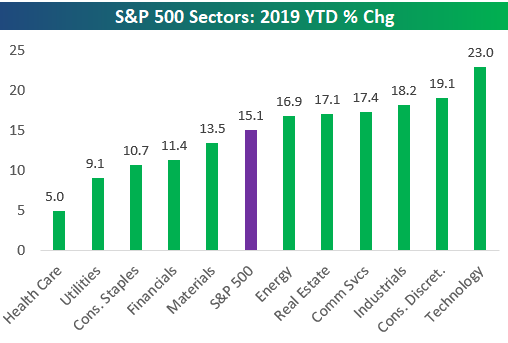
In this week’s Sector Snapshot, we highlight Tech’s ridiculous gains so far this year plus continued weakness for Health Care relative to the rest of the market.
To gain access to the report, please start a two-week free trial to our Bespoke Premium package now. Here’s a breakdown of the products you’ll receive.
Claims Bode Well For Equities
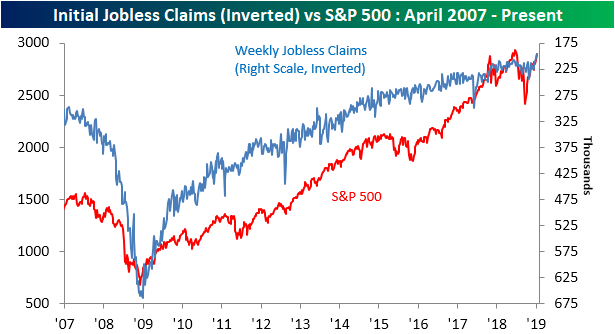
Earlier today on our Twitter account, we retweeted a chart from Bloomberg’s Joe Weisenthal of inverted Jobless Claims versus the S&P 500. We have used this chart as an argument for the bullish case for the past several years. As we mentioned in a blog post this morning, Initial Jobless Claims came in earlier this week with a sizable drop off, down to 196K versus last week’s revised 204K and expectations of 210K. This week’s print was not only a new low for the current cycle, it is also the lowest reading since 1969. That sort of new low could be a good sign for equities. As shown in the chart below, claims and the S&P have mirrored each other since bottoming following the financial crisis. (In the chart, we have inverted claims on the right axis.) As the S&P 500 inches its way back towards all time highs, so has claims towards new lows. Additionally, with recent low prints for claims bucking what had previously appeared to be an upside trend reversal, the bullish case for the S&P 500 is growing.
Start a two-week free trial to Bespoke Premium to access our interactive economic indicators monitor and much more.
Sector Charts – 4/11/19 – Technology
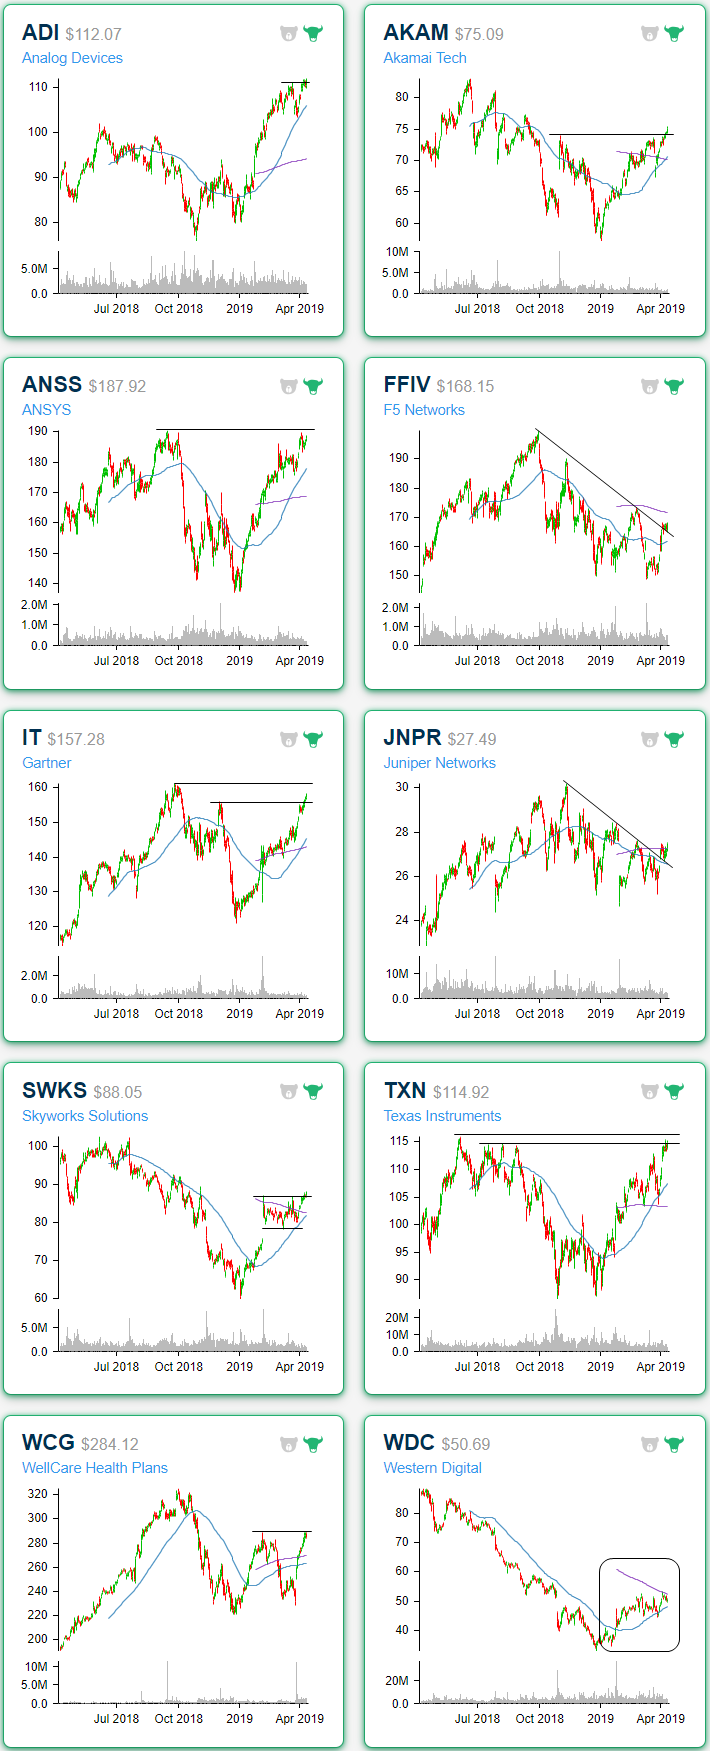
Our Chart Scanner tool offers an effective and convenient way to quickly scan through a large number of stocks and ETFs to search for potential opportunities. Panning through the S&P 500 Technology Sector, there are a number of attractive chart patterns forming. Starting with Analog Devices (ADI), the stock has been on a tear this year rising from just barely over $80 in the first days of January all the way up to $112.55 today; around a 30% gain. At its current levels, the stock is eying a breakout following a pullback and a nice bounce off of the 50-DMA. Going forward, that moving average is likely to continue to act as support. Similarly, Akamai Tech (AKAM) is breaking out above prior highs established during the late 2018 sell off after it too found support at the 50-DMA.
While most stocks have long broken out of their downtrends that had begun in late 2018, two stocks — Juniper Networks (JNPR) and F5 Networks (FFIV) — have more or less been holding onto those trends for dear life. These two have been unable to press above their downtrend lines up until recently when they not only managed to break out but also came back to bounce off of these downtrend lines. JNPR also managed to take out the 200-DMA in the process.
Staying on the topic of moving averages, Western Digital (WDC) is seeing some interesting trading bouncing between its upward sloping 50-DMA and downward sloping 200-DMA. In the past few days, the stock has made a higher low near the upper end of this shrinking range, and a close above the 200-DMA would certainly be a positive sign of a move out of this consolidation.
While WDC is looking to make its final push up to resistance, there are four other stocks that are in interesting positions in regards to resistance. A few, like ANSYS (ANSS), Gartner (IT), and Texas Instruments (TXN) have already taken out initial resistance in what has been a strong rally this year. Looking forward for these three, the next levels to watch are their 52-week highs. For ANSS, this will actually be the third time the stock has come up to test these levels around $190. Others are still some distance away from 52-week highs like Skyworks Solutions (SWKS). SWKS is currently breaking out of consolidation to the upside with the next resistance to watch around $89.50.
Sign up now for a free trial and instantly unlock access to our new Interactive tools, including the Chart Scanner and Earnings Explorer!
Netflix Buffers Ahead of Disney Streaming Event
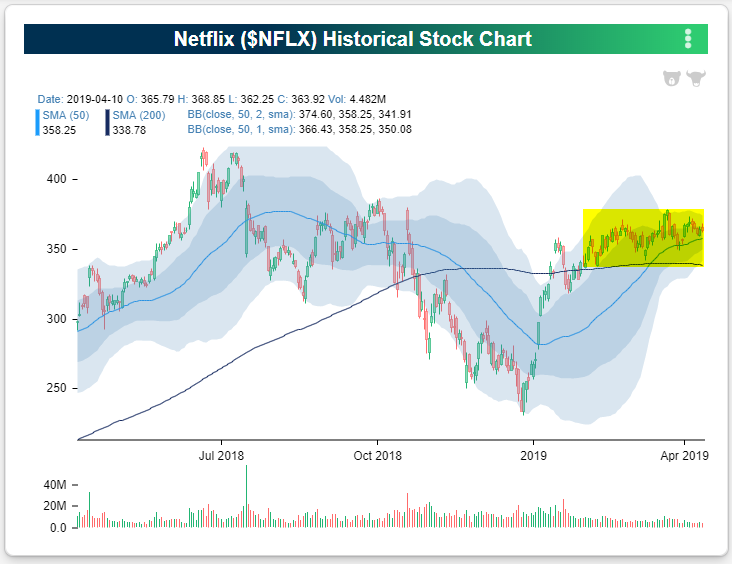
After surging off the December lows, Netflix (NFLX) has done its best impression of a show buffering with a slow internet connection – the stock has gone nowhere. The chart below is from our new and improved Chart Scanner tool, and as shown in the highlighted area, the stock has been trading in an extremely tight range relative to its normal trading pattern. Maybe the stock is just consolidating after its big move, or perhaps investors have been taking a wait and see approach ahead of Apple’s streaming announcement late last month and Disney’s (DIS) Investor Day on Thursday (4/11) where the company is slated to unveil its streaming plans. Sign up now for a free trial and instantly unlock access to our new Interactive tools, including the Chart Scanner and Earnings Explorer!
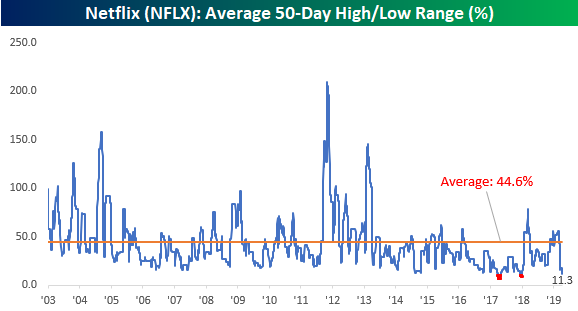
Whatever the cause of the pause, Netflix’s range over the last 50-trading days is near historic lows. With a high/low range (based on closing prices) of 11.3%, the stock’s trading range over the last 50 trading days is just one-quarter of its historical average and narrower than every other period in the stock’s history except two.
Those two periods where the stock traded in a narrower range were in early and late 2017 when the 50-day range briefly dropped below 10%. In the chart below, we show where those two prior periods occurred with respect to Netflix’s stock price since the start of 2016. For what it’s worth, in both periods where the stock finally moved out of that narrow range, the move was to the upside.

Horrible Fund Flows Despite Stable Markets
Yesterday the Investment Company Institute (ICI) reported its weekly tracker for flows into and out of mutual funds. In the table below, we show the size of fund flows as a percentile of all periods. As shown, flows for equity funds were brutal, with net flows smaller than 97.2% of prior periods for domestic equity funds in aggregate. Domestic large cap equity funds saw larger outflows than 98% of prior periods, while small cap mutual funds focused on domestic stocks saw outflows larger than 98.8% of prior periods. Despite negativity exhibited by equity mutual fund flows, the bond space has been thriving of late, with inflows to total bond funds better than 90% of all periods in the last three months, driven by taxable government bonds and municipal bonds. The most recent week saw very strong inflows to bond funds generally, mostly led by taxable government bonds but with a strong showing from investment grade credit, multisector bonds, and munis. Start a two-week free trial to Bespoke Institutional to receive our fund flow analysis on a weekly basis.
Chart of the Day: GDP Tracking Surges In Q1 After A Brutal Start
Optimism Growing Again
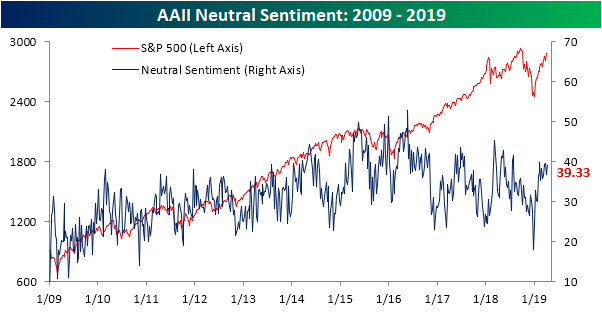
The American Association of Individual Investors updated their weekly investor sentiment survey this morning and the results are very similar to the final days of February with bullish sentiment around 40%, bearish down near 20%, and neutral once again in the upper 30’s. Up from 35.02% last week, bullish sentiment has crossed back over the 40% threshold; the first time it has done so since the previously mentioned week in February. While bullish sentiment is sitting a couple of points above the historical average, this is still several percentage points from reaching any sort of extreme level (more than one standard deviation above the aforementioned average). For that to happen, bullish sentiment would have to come in above 48.36%. If that occurs, then it could be a sign that investors are getting a little too optimistic.
Sign up for a free trial to see more of our research!
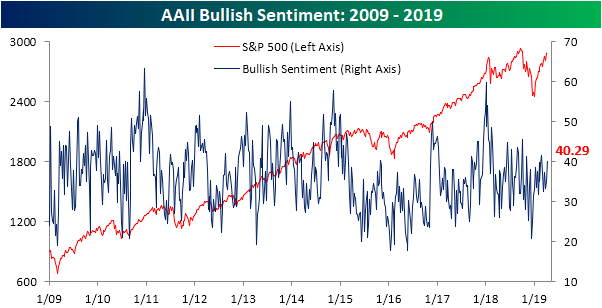
Bearish sentiment, on the other hand, fell all the way back down to 20.38% this week, the lowest since its 20% reading on February 28th. That is around 10% less than the historical average for bearish sentiment. That is also at the lower end of the range bearish sentiment has stayed within in the past decade.

Neutral sentiment has still yet to have moved above or below the upper 30’s coming in at 39.33% this week after falling from similar levels down to 36.71% last week. That is the third time in the past month that neutral sentiment has come in between 39% and 40%.
The Bespoke 50 Top Growth Stocks Index — 4/11/19
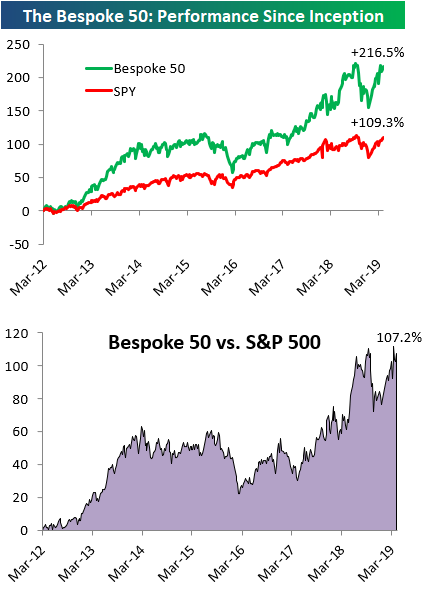
Every Thursday, Bespoke publishes its “Bespoke 50” list of top growth stocks in the Russell 3,000. Our “Bespoke 50” portfolio is made up of the 50 stocks that fit a proprietary growth screen that we created a number of years ago. Since inception in early 2012, the “Bespoke 50” has beaten the S&P 500 by 107.2 percentage points. Through today, the “Bespoke 50” is up 216.5% since inception versus the S&P 500’s gain of 109.3%. Always remember, though, that past performance is no guarantee of future returns.
To view our “Bespoke 50” list of top growth stocks, please start a two-week free trial to either Bespoke Premium or Bespoke Institutional.
Initial Jobless Claims Killing It
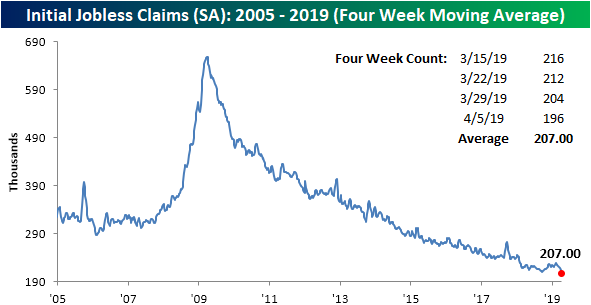
In addition to last week’s print, initial jobless claims data has seemed to have left the worrisome signs from earlier in the year in the rearview mirror. This morning’s stellar print of 196K was the lowest seasonally adjusted number since October 4, 1969 when claims came in at 193K. To further reiterate the strength of this indicator, the streak of consecutive weeks below 300K has now grown to 214; the longest such streak ever. Additionally, with older data having been revised a couple of weeks ago, the streak of readings at or below 250K is back on; now at 65 weeks. That is the second longest streak in the history of the data. The only one longer ended on January 1, 1970 at 89 weeks. Start a two-week free trial to Bespoke Premium to access our interactive economic indicators monitor to keep up to date on Initial Jobless Claims releases as well as many other US and global economic indicators.

Earlier this year, we highlighted that the less volatile look at initial jobless claims—the four-week moving average—had come in at a 52-week high two weeks in a row; a possible recessionary signal though there were plenty of instances of it happening outside of economic downturns. The tide has completely shifted since that analysis as the four-week average is now at a 52-week low! At 207K, it is also now at its lowest level since late 1969. In other words, it can now be more confidently said those highs were more of a blip rather than a trend higher.
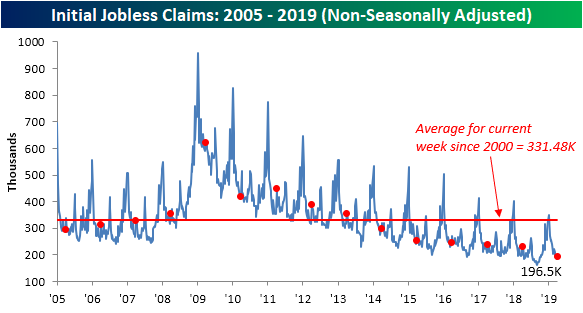
The non-seasonally adjusted data deviated a bit from the other versions with an increase from last week’s 183.8K to 195.5K today. This increase is perfectly normal as a rise in claims for the current week of the year can be observed every year going back to 2011. Regardless of the increase WoW, this week’s NSA number is just over half of the average for the current week since 2000. Also being the lowest print for the week of the current cycle, the NSA numbers still appear very strong.
Trend Analyzer – 4/11/19 – Dow Still Down
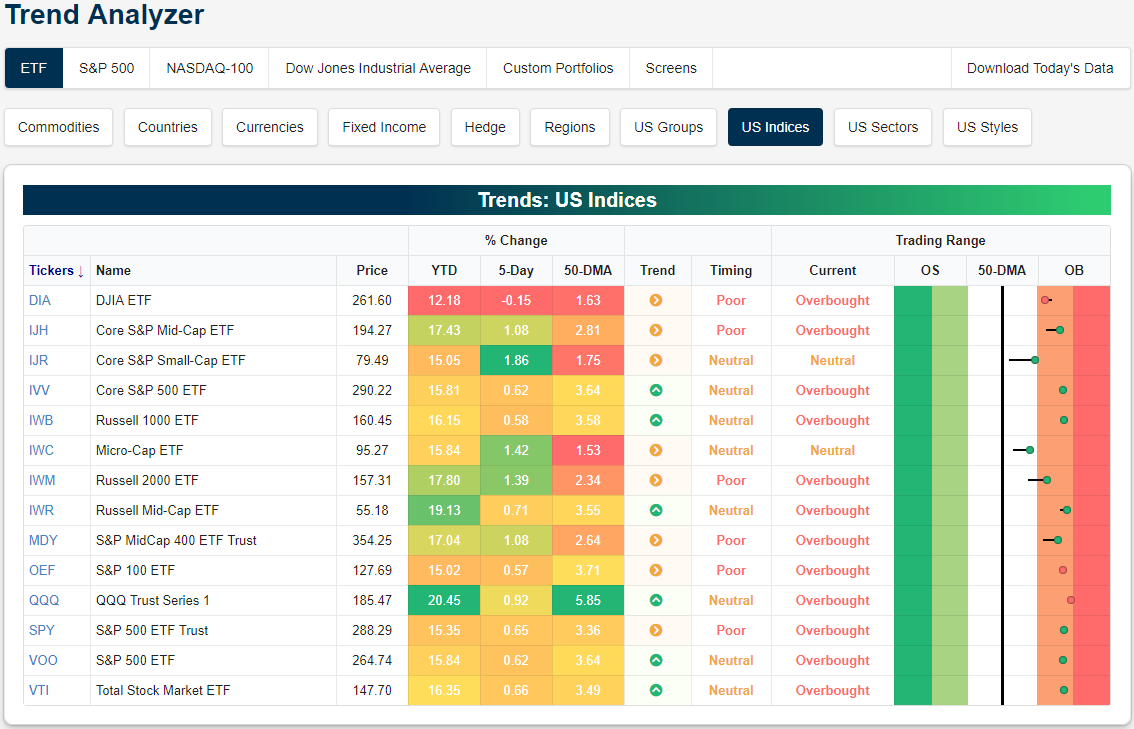
Yesterday’s small gain was still not enough to pare the losses over the past week for the Dow (DIA). DIA is still the only one in the red in the past week and is underperforming the rest of the major indices by an increasingly wide margin. While DIA is up just over 12% YTD, every one of its peers is up at least 15%, with the Russell Mid Cap (IWR) now up 19.13% and the Nasdaq (QQQ) up over 20%!
Small caps have begun to pick up the pace. While still at neutral, the Core S&P Small Cap (IJR) and Micro-Cap (IWC) are up the most in the past week. IJR is up the most at 1.86%. The rest of the major indices are still overbought with many still on the cusp of extreme levels as they have been for the past few days.
Start a two-week free trial to Bespoke Premium to access our interactive Trend Analyzer and much more.