Chart of the Day: Small Business Sentiment Doesn’t Get Much Better Than This
Bespoke Stock Scores — 8/14/18
Heavy Trading Metals
Copper is down a bit over 1.5%, and at this level would be closing at a new 52-week low. As we noted in our Chart of the Day yesterday, the decline in gold yesterday to new 52-week lows was relatively large. For copper, that’s not so true: this is only the 60th largest decline to a new 52-week low for the metal over the past 20 years. Still, copper has been hit hard, with relatively weak Chinese industrial production and fixed asset investment numbers reported overnight helping push futures to new lows as part of a longer stretch of dollar strength and EM weakness hurting prices. It’s hard to believe that prices were near multi-year highs less than three months ago.

Iron ore had rallied to a multi-month high to start the month of August, but it too is pulling back as metals continue to trade heavy.
The Closer — Don’t Fade The Red White & Blue, Or Maybe U Should Do — 8/13/18
Log-in here if you’re a member with access to the Closer.
Looking for deeper insight on markets? In tonight’s Closer sent to Bespoke Institutional clients, we review what the dramatic outperformance of US equities relative to the rest of the world means for that relative performance going forward. We also take a look at the performance of gold in other currencies and recent trends in policy uncertainty.

See today’s post-market Closer and everything else Bespoke publishes by starting a 14-day free trial to Bespoke Institutional today!
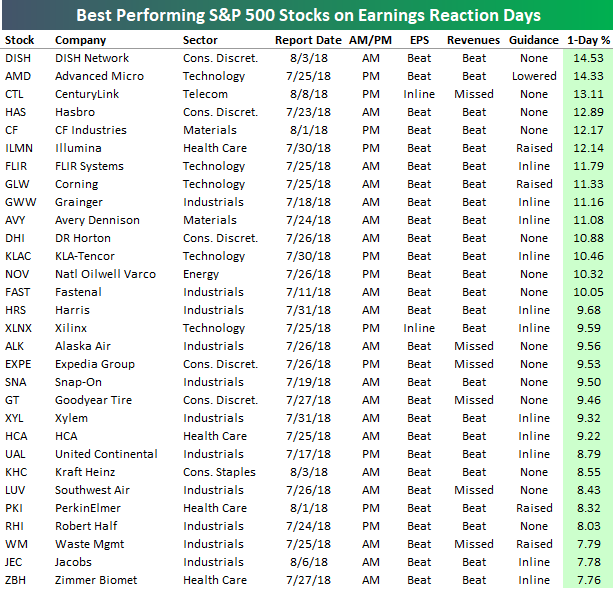
Best and Worst Performing S&P 500 Stocks on Earnings
Below is a look at the 30 best and 30 worst performing S&P 500 stocks on their earnings reaction days this season. DISH Network (DISH) posted a one-day gain of 14.53% on August 3rd following earnings, and that has held up as the best performer in the S&P 500 this season. Advanced Micro (AMD) ranks second with a one-day gain of 14.33%.
Other notables on the list of earnings season winners include Hasbro (HAS), Corning (GLW), Expedia (EXPE), and Kraft Heinz (KHC).
To rank in the top 30, a stock needed to have gained at least 7.75% on its earnings reaction day. Notice that none of the FAANG stocks made the list of biggest winners this earnings season.
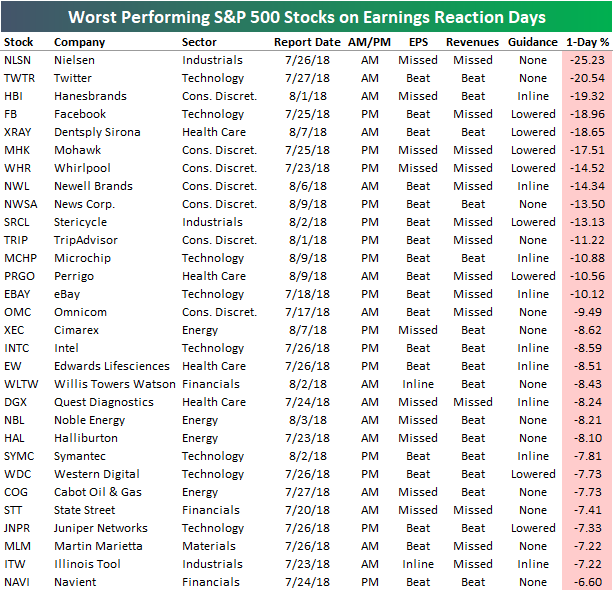
While no FAANG stocks made the list of biggest earnings season winners, one of them made the list of worst performers. As shown, Facebook (FB) posted a decline of 18.96% on its earnings reaction day following its report on July 25th, which was the fourth biggest drop of any S&P 500 stock this earnings season. Not to be outdone, social media competitor Twitter (TWTR) fell even more than Facebook when it reported two days later, dropping 20.54% for the 2nd worst decline on earnings this season.
Nielsen (NLSN) — the consumer engagement ratings company — has seen the biggest drop on earnings this season with a one-day decline of 25% on July 26th. Other notables on the list of earnings season losers include eBay (EBAY), News Corp (NWSA), Whirlpool (WHR), TripAdvisor (TRIP), Intel (INTC), and Halliburton (HAL).
Keep track of everything earnings related with a Bespoke Premium membership today!
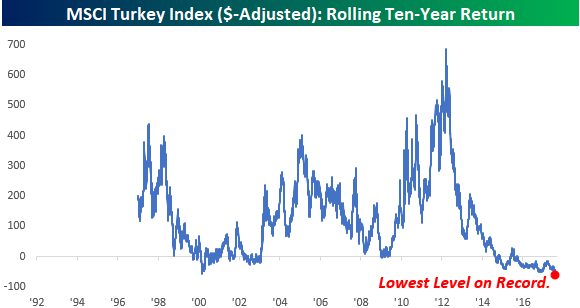
Record Low Returns in Turkey
If you’re like us, the constant talk about Turkey is getting about as tedious as the days after Thanksgiving when you are about to have your third or fourth sandwich of the weekend and you’re still up to your eyeballs in leftovers. At the risk of beating a dead horse, though, we found it noteworthy that through last Friday, the MSCI Turkey index (in $-adjusted terms) had clocked in its weakest rolling 10-year return since at least 1997 (data for the index doesn’t begin until 1987). Prior to Friday, the record for the most negative rolling ten-year return in the MSCI Turkey index was a decline of 58.4% through 2/23/01, and Friday’s rolling 10-year return was a decline of 62%.
With rolling 10-year returns hitting such an extreme level, you would think that there’s enough ‘blood in the streets’ to warrant dipping a toe in, but if history is a guide, you may be best off taking your time. The chart below shows the performance of the MSCI Turkey index since the start of 2000 through the end of 2003. We have also marked 2/23/01 (the prior trough for rolling 10-year returns) with a red dot. Looking forward from that date, the MSCI Turley index went on to fall an additional 36% before it finally bottomed, and nearly two and a half years later in late July 2003, it was still right around the levels it dipped to in February 2001.
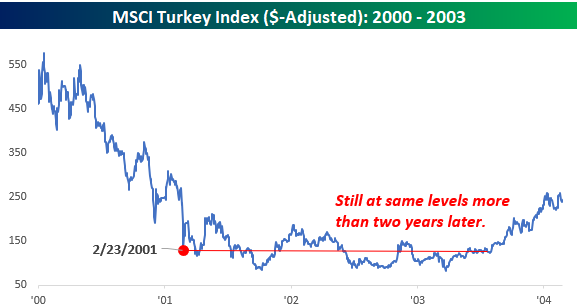
Chart of the Day: Gold Ready To Bounce From 52-Week Lows
Best and Worst Performing Sectors on Earnings
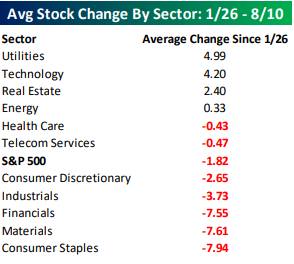
More than 2,000 companies have now reported their Q2 earnings results since early July, including 422 S&P 500 companies. Below we show the average one-day price change for stocks on their earnings reaction days broken out by sector and whether the stock is in the S&P 500 or not.
The average S&P 500 stock that has reported has gained 0.44% on its earnings reaction day this season, while the average non-S&P 500 stock has averaged a gain of 0.51%. While these two numbers are very close to each other, the performance numbers differ significantly when looking at individual sectors.
For example, the average non-S&P 500 Technology stock that has reported has gained 0.95% on its earnings reaction day this season, while the average S&P 500 Tech stock has actually fallen 0.60%. Tech has been the worst sector in the S&P 500 this season when it comes to stock price reactions. Investors have been “selling the news” for large-cap Tech, but they’ve been buyers of Tech at lower market cap levels.
The same is true for Financials, Energy, and Consumer Discretionary. S&P 500 stocks in these three sectors have averaged declines on their earnings reaction days this season, but non-S&P 500 stocks in these sectors have averaged gains. Non-S&P 500 Consumer Discretionary stocks have gained an average of 1.34% on their earnings reaction days, which is the second best of any sector.
On the flip side, Utilities, Health Care, Real Estate, and Materials stocks in the S&P 500 have averaged gains on their earnings reaction days, while non-S&P 500 stocks in these sectors have averaged declines.
The only two sectors where investors have been big buyers on earnings regardless of market cap is Industrials and Consumer Staples. Stocks in these two sectors have seen huge gains this earnings season. The average Industrials stock in the S&P 500 has gained 2.42% on its earnings reaction day, while the average Consumer Staples stock in the S&P 500 has gained 2.62%. Non-S&P 500 Industrials and Consumer Staples stocks have gained 0.78% and 1.90%, respectively, on their earnings reaction days.

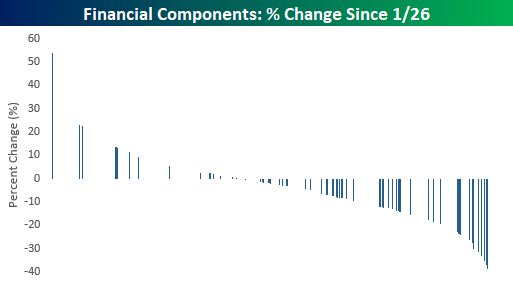
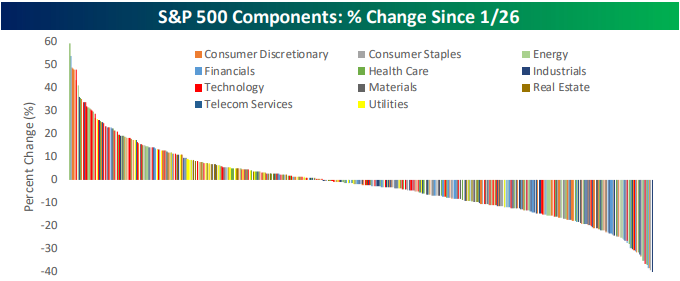
Sector Performance Breakdown Since the 1/26 Peak
The waiting game for new highs in the S&P 500 continues. Even though the S&P hasn’t moved much at the index level since January 26th, many of its components have seen big moves. The table below summarizes the average performance of individual S&P 500 components grouped according to sector since the 1/26 closing high. Leading the way higher, Utilities has been the best sector with an average gain of just under 5%, but right on the sector’s heels is Technology where stocks are up an average of 4.2%. Besides these two sectors, the only two other sectors where the average stock is up since 1/26 are Real Estate and Energy. To the downside, in three sectors (Consumer Staples, Materials, and Financials), the average stock is down over 7%. That’s quite a big decline given that the S&P is within 2% of record highs.
The chart below shows the return of individual S&P 500 stocks since 1/26 color coded according to sector. Among the 500 individual components in the index, there are a number of big winners and big losers which have each moved over 25%.
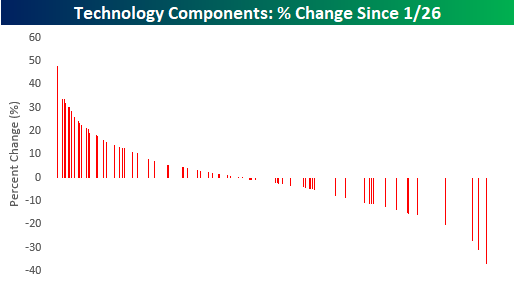
While it nearly impossible to distinguish between each color bar in the chart above, we did it that way for a reason. Below we only show the returns of stocks in the Technology sector from the chart above. Even though Tech hasn’t been the absolute best performer over that period, because of the large number of stocks in the sector and the fact that most of them have seen positive returns, the sector has had a major positive impact.
For Financials, it’s the exact opposite. While stocks in the sector are only the third worst in terms of average performance, because there are so many stocks in the sector and they are mostly lower, the Financials have been a major drag.