Death, Taxes, and Strong Jobless Claims Reports
Yeah, jobless claims are starting to get that dependable in terms of delivering a strong weekly print. This week’s report was no different as first-time claims came in at 212K versus estimates of 215K. So now it’s time to update the streaks. This week’s report was the record 180th straight week of sub-300K claims, the 45th straight week where claims were at or below 250K (longest streak since 1970), and the 6th straight week that claims were at or below 220K (longest streak since 1969).
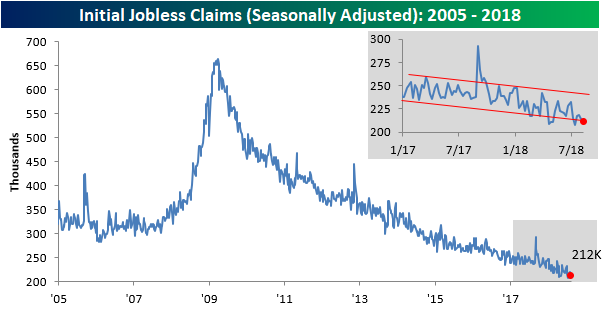
Despite the decline in claims this week, the four-week moving average increased to 215.5K, which is 2K above the multi-decade low of 213.5K from mid-May. Unless we get a print below 209K next week, the May low will hold for at least another week.

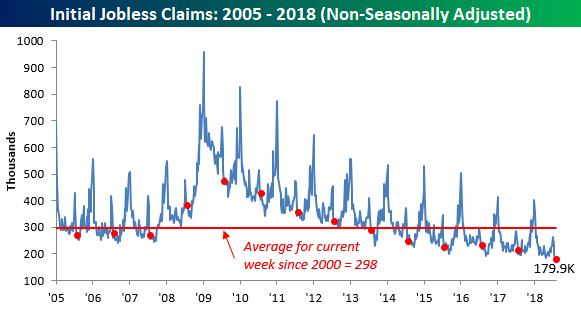
Finally, on a non-seasonally adjusted (NSA) basis, jobless claims dropped to 179.9K. For the current week of the year, this is the lowest reading on record and nearly 120K below the average of 298K dating back to 2000.
Fixed Income Weekly – 8/16/18
Searching for ways to better understand the fixed income space or looking for actionable ideals in this asset class? Bespoke’s Fixed Income Weekly provides an update on rates and credit every Wednesday. We start off with a fresh piece of analysis driven by what’s in the headlines or driving the market in a given week. We then provide charts of how US Treasury futures and rates are trading, before moving on to a summary of recent fixed income ETF performance, short-term interest rates including money market funds, and a trade idea. We summarize changes and recent developments for a variety of yield curves (UST, bund, Eurodollar, US breakeven inflation and Bespoke’s Global Yield Curve) before finishing with a review of recent UST yield curve changes, spread changes for major credit products and international bonds, and 1 year return profiles for a cross section of the fixed income world.
We take a look at differences between investment grade and high yield credit risk metrics.

Our Fixed Income Weekly helps investors stay on top of fixed income markets and gain new perspective on the developments in interest rates. You can sign up for a Bespoke research trial below to see this week’s report and everything else Bespoke publishes free for the next two weeks!
Click here and start a 14-day free trial to Bespoke Institutional to see our newest Fixed Income Weekly now!
Chart of the Day: “The Yield Curve Doesn’t Matter”
The Closer — Staples Breaking Out, Data Deluge, Oil Swoons — 8/15/18
Log-in here if you’re a member with access to the Closer.
Looking for deeper insight on markets? In tonight’s Closer sent to Bespoke Institutional clients, we take a look at the strong relative performance and breakouts of the Consumer Staples sector versus other sectors and the broad S&P 500. We also review today’s data: industrial production, productivity, and EIA data.

See today’s post-market Closer and everything else Bespoke publishes by starting a 14-day free trial to Bespoke Institutional today!
Empire Manufacturing Rebounds
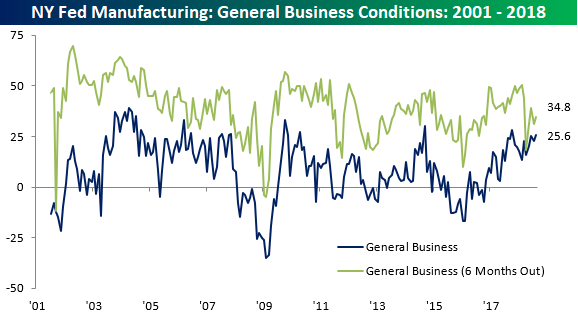
Manufacturing activity in the New York region heated up right with the temperature in August as the Empire Manufacturing survey unexpectedly rose to 25.6 versus estimates for a reading of 20. As shown below, the tracker for General Business conditions hit its highest level since last October. Expectations, however, remain a bit more subdued. While the index for Business Conditions six months from now increased on a m/m basis, it remains well off of its recent highs.
The table below breaks out this month’s report by each of its subcomponents for both current conditions and expectations. Here again, we can see that manufacturers are a lot more optimistic about the present than the future. Of the nine components in the Current Conditions category, just three declined, and none of the drops were exceptionally large. On the upside, Shipments and Unfilled Orders both saw large increases, while Prices Paid saw just a modest increase (Prices Received actually declined).
Looking out over the next six months, most components actually saw declines as Shipments, Prices Paid, Cap Ex, and Tech Spending were the only categories that increased relative to July’s readings.
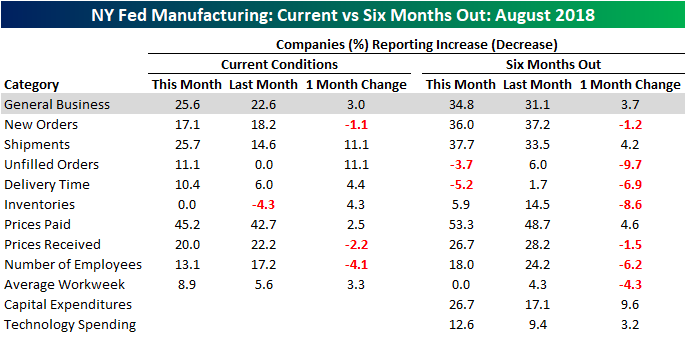
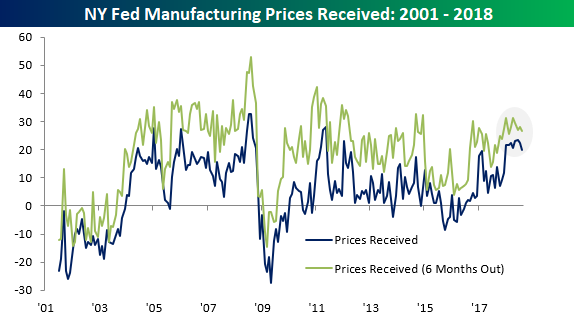
Obviously, inflation readings have become increasingly scrutinized by the market lately, so it’s encouraging to those fearful of inflation accelerating that the recent moves in both Prices Paid and Prices Received haven’t been as one-directional to the upside. In the case of both Prices Paid and Prices Received, the indices for both Current Conditions and Expectations have stalled out in the last few months. While it could be nothing more than a breather, recent declines in commodity prices should help to keep some level of gravity on prices.

Ta-Rough
You can say whatever you want about tariffs and the pros and cons on both sides of the argument, but with respect to the metals and mining companies, keep your ‘pros’ to yourself. The group has been stuck in a downtrend ever since the topic of tariffs first came up, and it’s now basically in full flush mode.
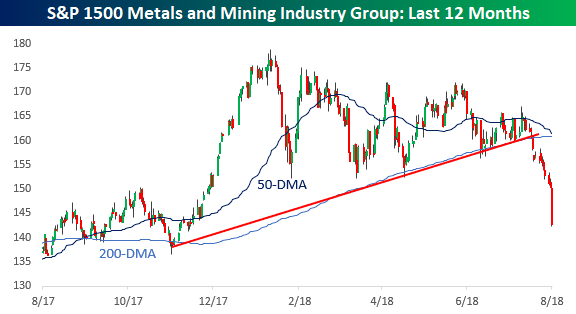
The table below lists the individual components of the group and how they’ve performed over the last six months, a period which roughly coincides with when the Administration brought up the topic of taxing steel imports in early March. During this period, just two out of the twenty members of the group have traded up, and the best of them just happens to be a member of our Model Growth Portfolio! The remaining 18 members of the group are not only down, but they are down big. Eleven of them are down over 10%, and five of those are down over 20%, including Century Aluminum which has been cut in half!

Chart of the Day: Opportunity With Energy Extremely Oversold
B.I.G. Tips – Bricks and Mortar Not Going Down Without a Fight
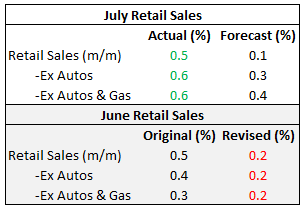
When it comes to the July Retail Sales report, it has historically been one of the better ones relative to expectations. This year was no exception as we saw a strong beat relative to expectations not only on the top line but also when you strip out the impact of Autos and Gas. While July’s data was strong, though, it comes off a lower base as June’s originally reported strong numbers were all revised lower. After taking both the downside revision and July’s strength into account, it ends up being slightly more positive than a wash.
In terms of breadth, the results of this month’s report were positive again with nine components increasing and just four declining. Both the Clothing and Bars and Restaurants sectors showed m/m growth of 1%+. Sporting goods was the only decliner of more than 1%.

Online sales are a category that has been eating the lunch of traditional brick and mortar retail for some time, but in this month’s report, there were some signs starting to emerge that traditional retail isn’t going down without a fight. Even as the above table illustrates, other sectors of the economy showed much more growth than Non-Store retailers this month. In our latest B.I.G. Tips report, we covered all of the major trends surrounding this month’s retail sales report as well as some longer-term trends that may be starting to shift a bit towards the favor of traditional retailers.
This one is a must-read. To see it, sign up for a Bespoke Premium membership now!
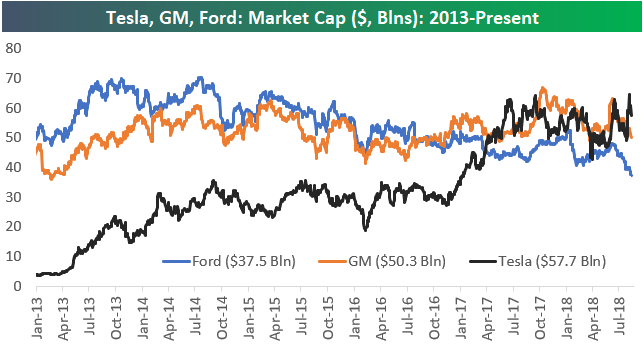
Tesla (TSLA) the 4th Largest Automaker in the World
While all three have seen their market caps drop over the past few days, note below that Tesla’s (TSLA) recent move higher on the “$420” news leaves its market cap higher than both Ford (F) and General Motors (GM). Back in early 2013, Ford and GM both had market caps around $50 billion, while Tesla was at just over $2 billion. Ford saw its market cap top out around $70 billion in mid-2013 and mid-2014, but since then it has been steadily dropping lower. At this point Ford has lost nearly half of its market cap in the last four years. The market cap for GM has been much steadier over the past few years right around the $50 billion level.
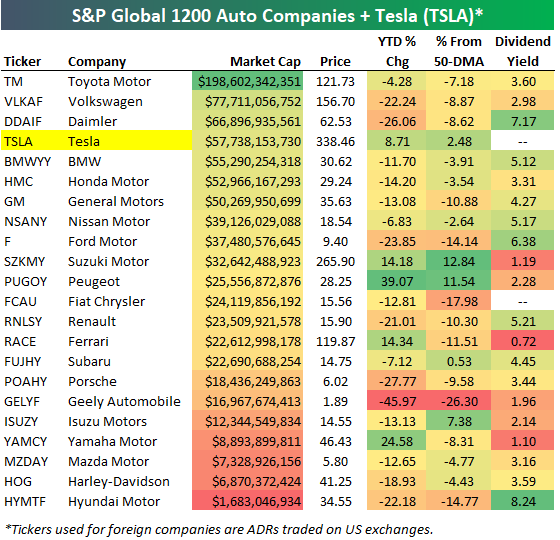
The US automakers aren’t the only ones struggling. Automakers globally have been trading terribly in 2018. Below is a table of the major automakers around the world (from the S&P 1200 Global Autos group). We’ve included Tesla (TSLA) in the table as well even though it’s not in the group. Of the 22 stocks listed, 17 are in the red year-to-date. Along with Tesla, the only ones in the green this year are Suzuki (SZKMY), Peugeot (PUGOY), Ferrari (RACE), and Yamaha (YAMCY).
With all the share-price weakness for autos, dividend yields have gotten pretty elevated. Hyundai now yields over 8%, Daimler yields 7.17%, while BMW, Nissan, Ford, Renault, and Hyundai all yield more than 5%.
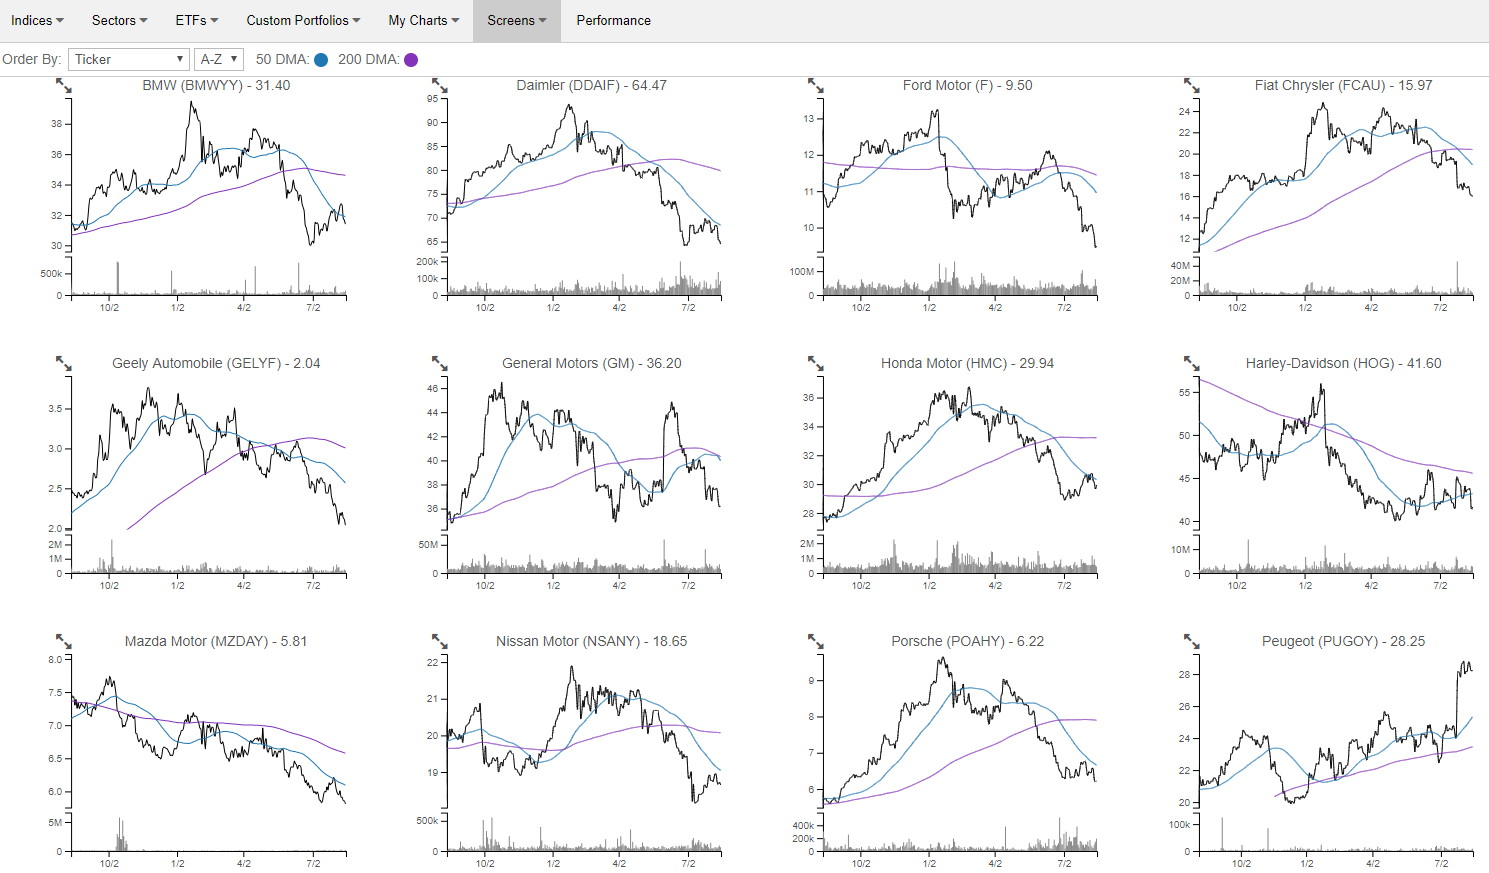
If you haven’t used our Chart Scanner tool, we’ve created a portfolio of the global automakers shown in the table above so you can easily see how horrible most of their chart patterns look. Our Chart Scanner lets users quickly and easily browse through dozens and dozens of charts in mere seconds to identify broad trends (like weakness across autos) or find charts that look bullish or bearish. (We provide a snapshot below.) If you’re a Bespoke Premium subscriber or higher, you can click on the charts to mark them as bullish or bearish, and we’ll save them all for you so you can come back to them whenever you want. Go ahead and check out the autos in our Chart Scanner now. If you’d like to unlock the full version, you can start a free trial to Bespoke Premium.
Share of Consumers Facing Collection Collapsing
One of our favorite obscure US economic data releases is the New York Fed’s quarterly cut-up of US household debt numbers. In addition to a variety of interesting data points on the level, growth rate, and composition of household debt, the report also discusses credit performance in very close detail. Among the metrics included are estimates of the number of Americans facing foreclosure, bankruptcy, or collections proceedings. We show these in the chart below.
You’ll notice a huge spike in bankruptcies in the early-2000s, way before the recession. That was driven by changes in bankruptcy law that made the option less attractive for consumers, hence the huge spike and sudden halt in bankruptcy filings. While bankruptcies did rise a bit in Q2 versus Q1 (part of a normal seasonal pattern), both the number of foreclosures and the number of bankruptcies remain extremely low. Even more impressive is the recent collapse in the share of consumers who are facing collection proceedings. As shown, those have swung from nearly 15% in 2012 to a paltry 9% today. That’s a good sign for both the current state of consumer credit performance and the outlook for consumers’ ability to access credit.