September Seasonals
The snapshot below is pulled from last Friday’s Bespoke Report newsletter. Read the entire report with a two-week free trial to any membership level.
Historically, September has been the worst month of the year for the US equity market. But further research into the historical numbers shows that investors may not need to be as concerned about this September.
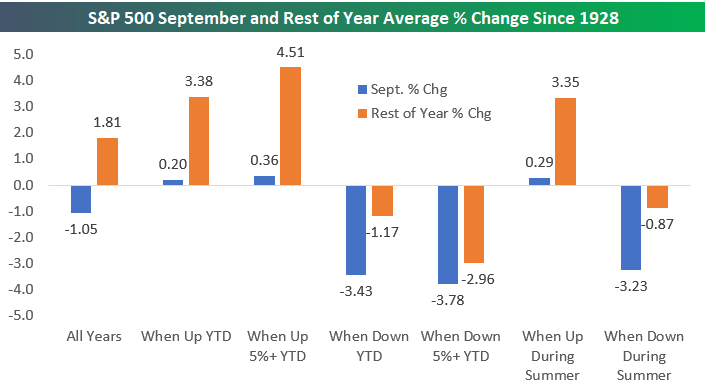
In the chart below, we show the S&P 500’s average percentage change in the month of September and from September through year end based on a number of performance-related scenarios.
For all years since 1928, the S&P has averaged a decline of 1.05% in September, and the index has averaged a gain of 1.81% from September through year end.
In years when the S&P 500 is up YTD through August (it’s up ~8% this year), however, the S&P has actually averaged a gain of 0.20% in September, and a gain of 3.38% from September through year end. When the index has been up more than 5% YTD through August (as it is this year), the average change in September has been positive again at +0.36%, and the rest-of-year gain is +4.51%.
It’s the years in which the S&P has been down YTD through August that September has been ugly. When the S&P has been in the red through August, September has seen an average decline of 3.43%. When the index has been down 5%+ YTD through August, September has averaged a decline of 3.78%.
Finally, when the S&P has been up during the summer months (May through August), September has been positive as well, averaging a gain of 0.29%. The May through August period this year saw the S&P gain more than 9% for its best summer since 2009. When the S&P has been down during the summer months, the S&P has averaged a decline of 3.23% in September.
While September has indeed been the worst month of the year for stocks, the negativity usually comes during years when the market is already struggling entering the month. That’s simply not the set-up in place this year.
Bespoke Market Calendar — September 2018
Please click the image below to view our September 2018 market calendar. This calendar includes the S&P 500’s average percentage change and average intraday chart pattern for each trading day during the upcoming month. It also includes market holidays and options expiration dates plus the dates of key economic indicator releases.

Bespoke Brunch Reads: 9/2/18
Welcome to Bespoke Brunch Reads — a linkfest of the favorite things we read over the past week. The links are mostly market related, but there are some other interesting subjects covered as well. We hope you enjoy the food for thought as a supplement to the research we provide you during the week.
Trade Economics
The economics of revoking NAFTA by Raphael Auer, Barthélémy Bonadio and Andrei A Levchenko (BIS Working Papers)
This quantitative effort seeks to identify the potential economic costs of a revoked NAFTA, with a range of estimates: as much as $99bn USD in combined tri-national real GDP losses being the worst case and $5bn should tariffs alone change. [Link]
Code Gone Wild
The Untold Story of NotPetya, The Most Devastating Cyberattack In History by Andy Greenberg (Wired)
A Russian effort to cripple the infrastructure of Ukraine jumped rapidly across networks to infect and devastate the tech infrastructure underpinning huge swathes of the global economy. [Link; soft paywall]
Franken-algorithms: the deadly consequences of unpredictable code by Andrew Smith (The Guardian)
The development of interlocked and opaque algorithms which have rapidly proliferated and now govern vast swathes of our lives has created a series of ethical conflicts which are nearly irreconcilable. [Link]
The World Isn’t as Bad as Your Wired Brain Tells You by Christopher Mims (WSJ)
What you see on your Twitter feed or Facebook timeline is not a function of random chance; rather, it’s shaped by algorithms that want you to keep reading or interact as opposed to presenting you a realistic or accurate portrayal of reality. [Link; paywall]
Investing
A Market Shakeup Is Pushing Alphabet and Facebook Out of the Tech Sector by Daren Fonda (Barron’s)
S&P and MSCI are in the process of re-aligning their approach to sectors, with the biggest result being a new sector (“Communications Services”) replacing “Telecoms”. [Link; paywall]
What Will Always Be True by Nick Maggiulli (Of Dollars And Data)
Tech companies may seem to be reinventing the rules of investing and even in a certain sense economics, but their growth in revenue is profoundly correlated to the growth in the number of employees they have. [Link]
Labor & Income
The Online Gig Economy’s ‘Race to the Bottom’ by Alana Semuels (The Atlantic)
An investigation of the economics and implications of online sites that allow for cheap access to services provided by freelancers around the world. [Link]
Social Wealth Fund for America by Matt Beuenig (Peoples’ Policy Project)
Bruenig proposes an “ownership society” that looks very different from the traditional Reaganite use of the term: government purchases of equity stakes in firms, with each citizen receiving an equal claim on the wealth and dividends. [Link]
Weather
The Atlantic Has Been Quiet—Too Quiet—This Hurricane Season by Brian K. Sullivan (Bloomberg)
A year of cool water and dry air from the Sahara have meant that hurricanes in the Atlantic basin are much, much less intense than they have been in recent seasons. [Link]
SCOTUS
Supreme Court Survey by Robert Green and Adam Rosenblatt (C-SPAN/PSB)
In this survey of likely voters, the Supreme Court gets a surprisingly uniform approval rating from various party and ideological identifications; that’s becoming increasingly uncommon in our hyper-partisan era of politics. [Link; 33 page PDF]
The Doctor Is Out
As an Economic Forecaster, Copper Fails Miserably by Stephen Mihm (Bloomberg)
While market commentators often ascribe a mythical reliability forecasting economic cycles to copper, in reality the metal is not very effective as a judge of what happens next with output growth. [Link; soft paywall]
Read Bespoke’s most actionable market research by starting a two-week free trial today! Get started here.
Have a great Sunday!
The Bespoke Report — 8/31/18
The Closer: End of Week Charts — 8/31/18
Looking for deeper insight on global markets and economics? In tonight’s Closer sent to Bespoke clients, we recap weekly price action in major asset classes, update economic surprise index data for major economies, chart the weekly Commitment of Traders report from the CFTC, and provide our normal nightly update on ETF performance, volume and price movers, and the Bespoke Market Timing Model. We also take a look at the trend in various developed market FX markets.
Below is a snapshot from today’s Closer highlighting weekly intraday price charts for major equity indices and other asset classes. If you’d like to see more, start a free trial below.

The Closer is one of our most popular reports, and you can sign up for a free trial below to see it!
See tonight’s Closer by starting a two-week free trial to Bespoke Institutional now!
Consumers See A Rosy Future, Driven By Income Gains
As we noted earlier, University of Michigan Consumer Confidence beat expectations but fell sequentially, further retreating from the highs set back in March. While the underlying index has drawn down a bit, some underlying details were extremely strong. As shown in the chart below, a rising share of consumers report buying conditions are good because they believe there are prosperous times ahead. It’s easy to understand why when we also look at the median expectation for income growth in the next year: 2.4% and rising quickly. We note that both of these indicators look very different from the last expansion, when income growth expectations slowly trended lower and a much lower share of households reported good buying conditions thanks to expectations of prosperity.
August a Continuation of Trend
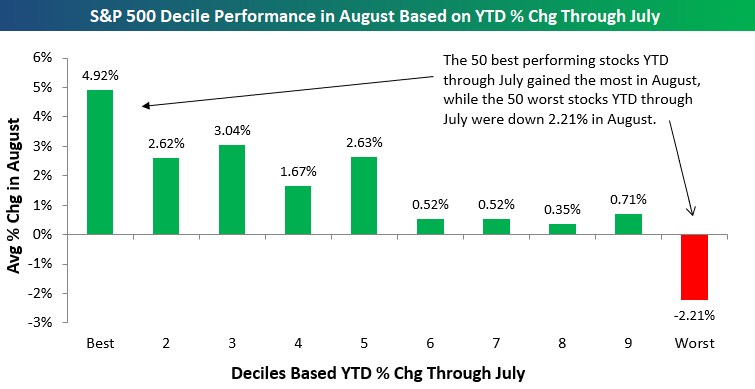
Below we show our decile analysis of S&P 500 gains in August. To construct these analyses, we show how each 10% bucket of stocks in the S&P 500 (50 per bucket) by a given metric performs. In this example, we’ve broken the S&P 500 into deciles based on their percentage change in the first 7 months of the year through July. Over the course of August, performance in the other 7 months was highly correlated to performance this month. As shown in the chart below, the 50 best performing stocks YTD through July were up almost 5% in August, with the 2nd through 5th deciles also performing quite well. The bottom half of the market in terms of YTD performance through July generally didn’t do as well in August. That was most true for the 50 stocks that performed the worst through July, which dropped on average 2.2% in the month of August. Owning winners is often derided by contrarians as a way to underperform, but the decile analysis below is one example of momentum begetting more momentum in financial markets.
U Mich Beats Expectations, But Still Declines
Earlier today University of Michigan consumer confidence beat expectations, rising to 96.2 from 95.3 in the preliminary reading. Even with the uptick, the overall gauge is down from 101.4 in March, driven by declines in both current conditions and expectations. One reason to look past that relatively unimpressive showing was a much stronger number from the Conference Board gauge earlier this week, which hit the highest level since October of 2000 this month.
The Closer — Breadth At ATHs, EM Woes, Turkey Trade — 8/30/18
Log-in here if you’re a member with access to the Closer.
Looking for deeper insight on markets? In tonight’s Closer sent to Bespoke Institutional clients, we ask the question “how much do new highs for individual stocks matter given the market at new all-time highs?”. We also focus on the declines in EMFX, including a review of Argentina’s collapsing exchange rate, Turkish trade data, and the improving carry of EM relative to the USD on a realized basis. We also discuss the details of the personal income and spending report from the BEA for the month of July.

See today’s post-market Closer and everything else Bespoke publishes by starting a 14-day free trial to Bespoke Institutional today!
Bespoke’s Sector Snapshot — 8/30/18
We’ve just released our weekly Sector Snapshot report (see a sample here) for Bespoke Premium and Bespoke Institutional members. Please log-in here to view the report if you’re already a member. If you’re not yet a subscriber and would like to see the report, please start a two-week free trial to Bespoke Premium now.
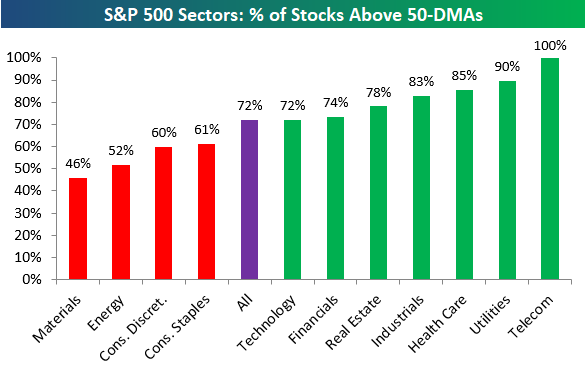
Below is one of the many charts included in this week’s Sector Snapshot, which shows the percentage of stocks in S&P 500 sectors trading above their 50-day moving averages. As shown, 72% of stocks in the broad S&P 500 are above their 50-DMAs, while seven of eleven sectors have readings stronger than 72%.
To find out what this means and to see our full Sector Snapshot with additional commentary plus six pages of charts that include analysis of valuations, breadth, technicals, and relative strength, start a two-week free trial to our Bespoke Premium package now. Here’s a breakdown of the products you’ll receive.