August Employment Report Preview
Heading into Friday’s Non-Farm Payrolls (NFP) report for August, economists are expecting an increase in payrolls of 194K, which would be an increase from July’s weaker than expected reading of 157K. In the private sector, economists are also expecting an increase of 194K. The unemployment rate is expected to tick down to 3.8% from last month’s reading of 3.9%. Average hourly earnings are expected to grow at a rate of 0.2% versus 0.3% last month, so a stronger than expected reading here may not be greeted positively by the market. Finally, average weekly hours are expected to be unchanged at 34.5

Ahead of the report, we just published our eleven-page preview of the July jobs report. This report contains a ton of analysis related to how the equity market has historically reacted to the monthly jobs report, as well as how secondary employment-related indicators we track looked in July. We also include a breakdown of how the initial reading for July typically comes in relative to expectations and how that ranks versus other months.
One topic we cover in each month’s report is the S&P 500 stocks that do best and worst from the open to close on the day of the employment report based on whether or not the report comes in stronger or weaker than expected. In other words, which stocks should you buy, and which should you avoid? The table below highlights the best-performing stocks in the S&P 500 from the open to close on days when the Non-Farm Payrolls report has been better than expected over the last two years.
Of the top performing stocks on days when NFP beats expectations, eight sectors are represented, but Consumer Discretionary leads the way with eleven. Vornado (VNO) has been the best performing stock with an average open to close gain of 2.72%, but it is followed by six stocks in the Consumer Discretionary sector which have all gained 1%+ from the open to close. Urban Outfitters (URBN), Michael Kors (KORS), and CH Robinson (CHRW) have all been up 90% of the time.
For anyone with more than a passing interest in how equities are impacted by economic data, this report is a must-read. To see the report, sign up for a monthly Bespoke Premium membership now!
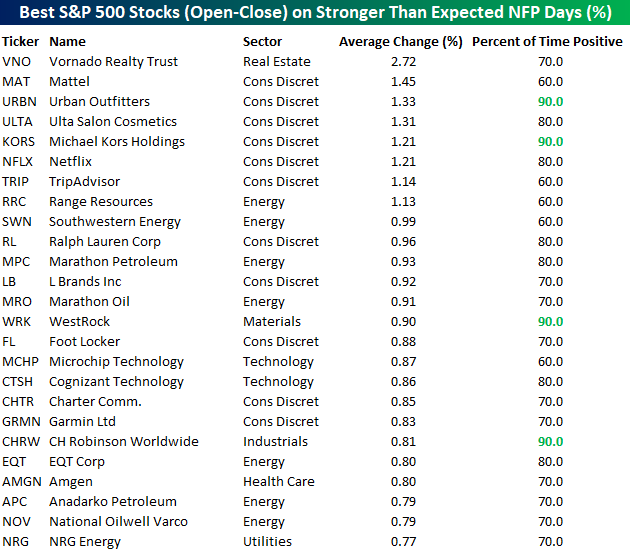
Chart of the Day: SWK Set To Surge?
Strength in the Services Sector
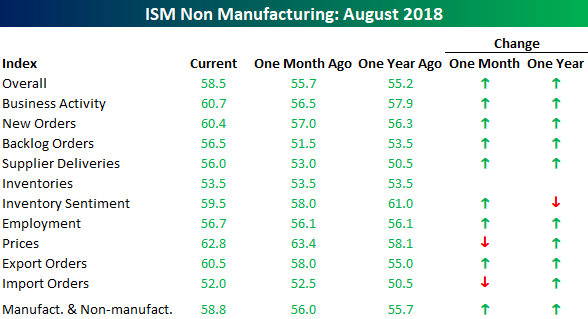
The release of the August ISM Non-Manufacturing report handily exceeded forecasts, coming in at a level of 58.5 versus consensus estimates for a reading of 56.8. The 1.7 point spread between the actual and reported number was also the biggest beat relative to expectations since the January report which was released on 2/5. On a combined basis, accounting for each sector’s share of the overall economy, this month’s Composite ISM came in at a level of 58.8. For perspective, the peak reading in this index for the current period was 59.9 last September.

The table below breaks down this month’s report by each of the index’s subcomponents. On both a m/m and y/y basis, breadth in the report was strong. The only two components that declined sequentially were Price Paid and Import Orders, while Inventory Sentiment was the only decliner relative to the same month last year. The biggest gainers this month relative to July were Backlog Orders, Business Activity, and New Orders.
Bullish Sentiment Remains Elevated
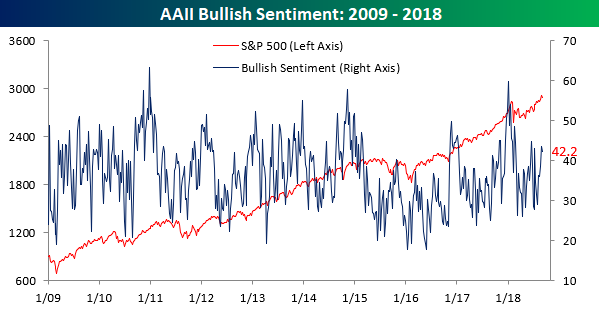
Individual investors continue to be in an optimistic mood, although bullish sentiment did see a slight decline in the latest week. According to the weekly survey from AAII, bullish sentiment dropped from 43.5% down to 42.22%, which is still on the high side of the recent range. It’s also the first back to back weeks where bullish sentiment has been above 40% since February. Given the relative weakness in equities this week, one could argue that it’s a bit of a surprise that bullish sentiment didn’t fall further.
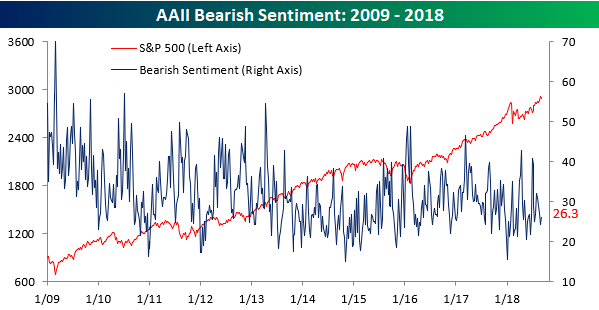
With the slight decline in optimism this week, bearish sentiment ticked slightly higher, rising from 24.39% up to a still relatively low level of 26.3%.
the Bespoke 50 — 9/6/18
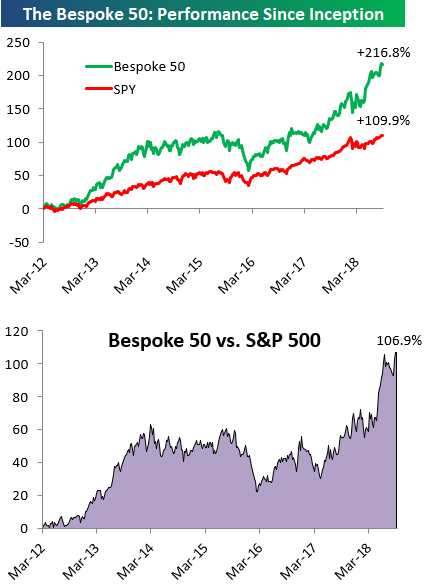
Every Thursday, Bespoke publishes its “Bespoke 50” list of top growth stocks in the Russell 3,000. Our “Bespoke 50” portfolio is made up of the 50 stocks that fit a proprietary growth screen that we created a number of years ago. Since inception in early 2012, the “Bespoke 50” has beaten the S&P 500 by 106.9 percentage points. Through today, the “Bespoke 50” is up 216.8% since inception versus the S&P 500’s gain of 109.9%. Always remember, though, that past performance is no guarantee of future returns.
To view our “Bespoke 50” list of top growth stocks, click the button below and start a trial to either Bespoke Premium or Bespoke Institutional.
Jobless Claims in Full 1969 Mode
Jobless claims continued to amaze this week coming in at a level of 203K versus consensus expectations of 213K. At this level, first time claims haven’t been lower since December 1969. This week’s report also marks a record 183 straight weeks where claims have come in at or below 300K, the 48th straight week where claims have been at or below 250K (longest streak since January 1970), and the 9th straight week where claims have come in at or below 225K (longest streak since 1969). As shown in the chart below, we’re now coming extremely close to the point where we may have to adjust the Y-axis lower.

With this week’s 203K print, the four-week moving average also posted a new cycle low of 209.5K- a level that hasn’t been seen since 1969.

On a non-seasonally adjusted (NSA) basis, claims fell to 172.4K. That’s the lowest level for the current week of the year dating all the way back to 1969 and more than 100K below the average of 283.4K for the current week of the year dating back to 2000.

Global Markets in the Red
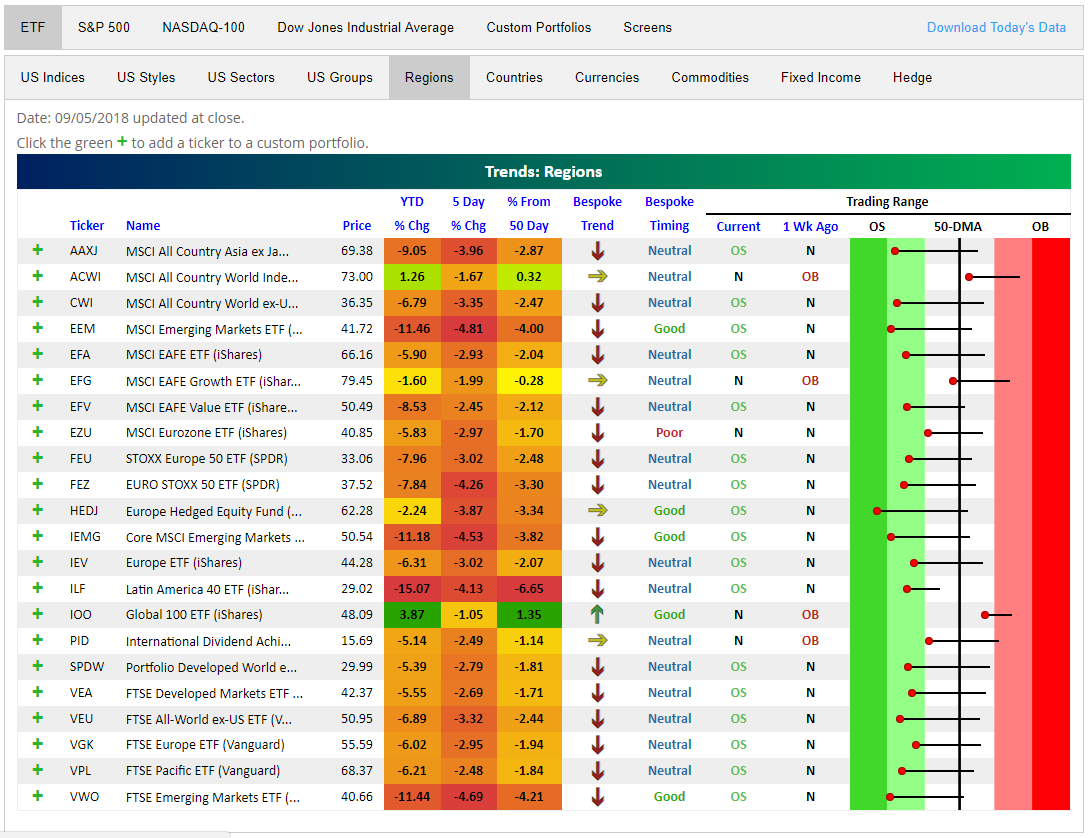
It has been a rough week for global equity markets. Below is a snapshot of recent action across regional equity ETFs using our popular Trend Analyzer tool. The Trend Analyzer is available to Bespoke Premium and Bespoke Institutional subscribers.
There is red shading all over in the snapshot, indicating weakness both on a near-term and longer-term basis. Last week at this time, most of these regional plays had recovered above their 50-day moving averages, but a sharp sell-off since last Wednesday has left just two ETFs above their 50-DMAs. These two ETFs are the only ones that include US equity exposure.
After 3-4% declines over the last week, almost every ETF is now back in oversold territory, with many at extreme oversold levels (dark green shading). From a longer-term perspective, you can also see that our proprietary Bespoke Trend ratings shows downtrends nearly across the board. On both an absolute and relative (to the US) basis, the year just keeps getting worse for international equity markets.
You can learn more about our proprietary Bespoke Trend and Bespoke Timing rating system at the bottom of our Trend Analyzer page.
B.I.G. Tips – US Economic Indicator Diffusion Index Loses Steam
The Closer — Decile, Trade, Canada — 9/5/18
Log-in here if you’re a member with access to the Closer.
Looking for deeper insight on markets? In tonight’s Closer sent to Bespoke Institutional clients, we take a long look at Canada, including both recent analysis of the BoC decision today and USDCAD, as well as a longer term look in terms of productivity and trade data releases from this morning. The Us also had trade data, and we start the note with a decile analysis using some non-traditional metrics for what’s been driving the US stock gain in 2018.

See today’s post-market Closer and everything else Bespoke publishes by starting a 14-day free trial to Bespoke Institutional today!