Retail Sales: The Streak Ends
When it comes to the September Retail Sales report, it has historically been one of the worst ones relative to expectations. Based on data from our Economic Indicators Database, the headline reading has only exceeded consensus expectations five times going back to 2001. That’s less than a third of the time! This year was no exception as we saw a big miss relative to expectations on the top line and a similar miss after stripping out Autos and Gas.
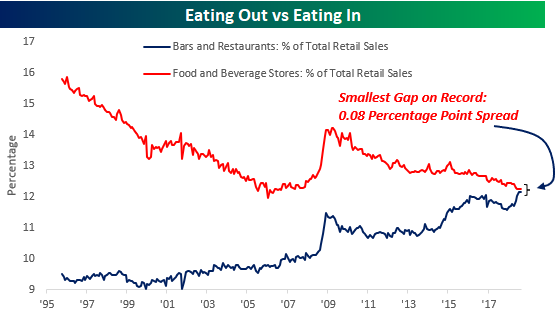
Our monthly update on Retail Sales, always highlights a number of key trends reflecting changing habits of the US consumer. This month’s report was no different. One interesting trend we wanted to highlight was the shift from ‘eating in’ to ‘eating out’. For several years now, we’ve seen Bars and Restaurants increase their share of total sales at the expense of Food and Beverage Stores. As shown in the chart below, though, this shift is on the verge of a major inflection point where Bars and Restaurants will overtake Food and Beverage stores in terms of their total share of retail sales. The house of tomorrow may not have a kitchen!
For anyone with more than a passing interest in the changing behavior of US consumers, make sure to check out this report. To see it, sign up for a monthly Bespoke Premium membership now!
The Closer — US vs The Rest, CPI Falters For Now, Dollar Slows — 9/13/18
Log-in here if you’re a member with access to the Closer.
Looking for deeper insight on markets? In tonight’s Closer sent to Bespoke Institutional clients, look into the drivers of the huge outperformance for US stocks versus the rest of the world. We also review today’s CPI report, the exploding US budget deficit, and the weakness of the USD that’s starting to manifest.

See today’s post-market Closer and everything else Bespoke publishes by starting a 14-day free trial to Bespoke Institutional today!
Bespoke’s Sector Snapshot — 9/13/18
Chart of the Day: Ducommun Inc (DCO)
Big Drop in Bullish Sentiment
The post-summer hangover after Labor Day weekend certainly didn’t sit well with individual investors. In this week’s sentiment survey from AAII, bullish sentiment dropped by over 10 percentage points, falling from 42.2% down to 32.1%. That’s the lowest weekly reading in optimism since the beginning of August and the largest weekly decline in bullish sentiment since late June.
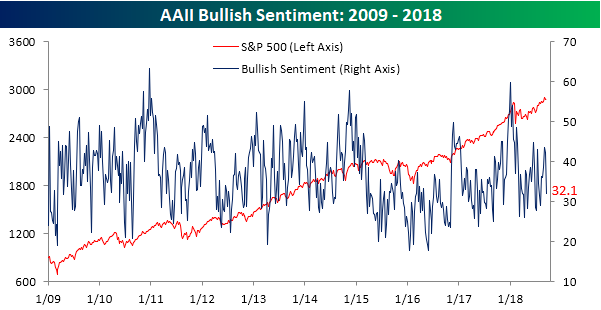
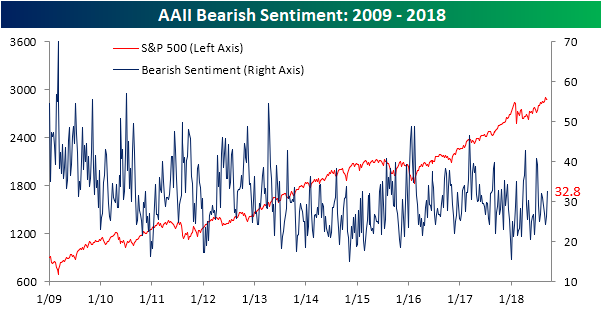
While bullish sentiment plunged, not all of those former bulls went straight into the bearish camp. In fact, it was just about two-thirds as negative sentiment increased from 26.3% up to 32.8%. That increase was still the largest weekly increase since late June and is the first time since the start of August that bears have outnumbered bulls.
the Bespoke 50 — 9/13/18
Every Thursday, Bespoke publishes its “Bespoke 50” list of top growth stocks in the Russell 3,000. Our “Bespoke 50” portfolio is made up of the 50 stocks that fit a proprietary growth screen that we created a number of years ago. Since inception in early 2012, the “Bespoke 50” has beaten the S&P 500 by 110.0 percentage points. Through today, the “Bespoke 50” is up 219.9% since inception versus the S&P 500’s gain of 109.9%. Always remember, though, that past performance is no guarantee of future returns.
To view our “Bespoke 50” list of top growth stocks, click the button below and start a trial to either Bespoke Premium or Bespoke Institutional.

Jobless Claims Stuck in the Sixties
Like an aging hippie that just can’t get with the times, weekly jobless claims remain at levels not seen since the 1960s. This week’s report came in at 204K versus estimates for a reading of 210K and was the lowest weekly print since December 1969. Pretty soon we’re going to have to adjust the Y-axis lower! Weekly claims have now been at or below 300K for a record 184 straight weeks, at or below 250K for 49 straight weeks (longest streak since January 1970), and at or below 225K for ten straight weeks (longest streak since 1969).
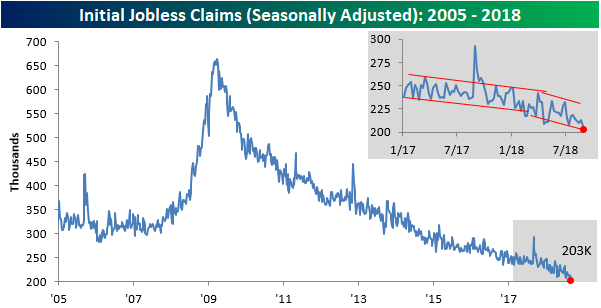
This week’s generational low in weekly claims also dragged the four-week moving average lower by 2K, from 210K down to 208K. That’s also the lowest reading for this indicator since December 1969.

On a non-seasonally adjusted basis (NSA), claims dropped over 10K, falling from 172.4K down to 161.9K. For the current week of the year, that’s the lowest reading since 1969 and it’s more than 125K below the average of 289K for the current week of the year dating back to 2000.

The Closer — Optimistic ASEC — 9/12/18
Log-in here if you’re a member with access to the Closer.
Looking for deeper insight on markets? In tonight’s Closer sent to Bespoke Institutional clients, we review the two best-performing S&P 500 industries year-to-date, the reversal lower in vol markets, and stubborn spreads in high yield. We also delve into the annual update on income distribution, real income growth by demographic, poverty data, and health insurance coverage from the US Census before finishing up with a review of petroleum markets following the release of weekly EIA data on inventories, sources, and uses of petroleum products.
See today’s post-market Closer and everything else Bespoke publishes by starting a 14-day free trial to Bespoke Institutional today!
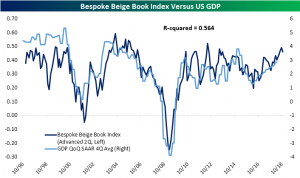
Beige Book Slightly Less Positive, But Showing Strong Growth
The Beige Book was released today with mostly positive findings. Districts generally reported moderate growth across the board. Transportation and manufacturing industries claimed moderate growth, while construction and real estate were slightly less positive. Our Bespoke Beige Book Index is still showing growth, but saw a decrease from the last period. The index is constructed by comparing the prevalence of positive words and negative words in the Beige Book. As shown in the chart below, we show the relationship between GDP and our Beige Book index. On the other hand, trade tensions’ effects on prices alongside a tight labor market seem to be the greatest constraints on the current economy.
A common concern among contacts has been the implications of trade tensions. Many cited tariffs as having an effect on input prices but were unable to pass costs along to customers. This was especially prevalent among manufacturers. Even though they have not been widely felt yet, rising prices are likely looming on the horizon.
The other concern which had widespread impacts was the tight labor market. Firms’ statements in the Beige Book are echoing Tuesday’s NFIB Small Business Optimism Index and JOLTS releases. Firms are having trouble filling roles for both skilled and unskilled labor. To try to fill openings, aside from higher wages, employers have resorted to additional benefits, vacation, and even increased training programs. Despite these efforts, firms just cannot seem to attract enough talent, although we wonder how bad things can be if simple wage hikes aren’t on the table.