Q2 2025 Earnings Conference Call Recaps: Equifax (EFX)
Bespoke’s Conference Call Recaps use AI to summarize lengthy earnings calls. The commentary below is AI-generated and then edited by Bespoke for quality control. As always, none of these summaries should be construed as recommendations to buy or sell any securities, and investors should do their own research and/or consult with a financial professional before making any investment decisions.
Our latest recap available to Bespoke subscribers covers Equifax’s (EFX) Q2 2025 earnings call.
![]()
Equifax (EFX) is a data, analytics, and technology company best known for its credit bureau services, but its reach extends into employment, income, identity, and fraud verification. Through platforms like The Work Number (TWN), Equifax offers real-time employment data, enabling government agencies, banks, auto lenders, and employers to make faster, more informed decisions. With its US cloud transformation complete, the company has built a modern infrastructure for multi-data solutions that combine credit, income, and alternative data. Its scale and regulatory relationships give it unique insight into consumer behavior, hiring trends, state budget dynamics, and credit market activity. The company’s earnings call spotlighted a growing divide between short-term government headwinds and long-term optimism, with One Big Beautiful Bill Act (OBBBA)-related requirements and IRS EITC (Earned Income Tax Credit) fraud detection driving a bullish long-range view. Mortgage revenue rose 20% despite 8.5% lower inquiry volumes, buoyed by strong pricing and TWN-enhanced preapproval products. Talent Solutions remained soft as corporate hiring slowed and job churn stayed low. The cloud-powered innovation engine is clearly working: US Information Services hit a 10% new product vitality rate, and international markets are seeing margin lift from efficiency gains. Caution around tariffs and economic uncertainty kept the second-half guide more subdued despite solid YTD results, and the stock fell as much as 7.3% on 7/22…
Continue reading our Conference Call Recap for EFX by becoming a Bespoke Institutional subscriber. You can sign up for Bespoke Institutional now and receive a 14-day trial to read our newest Conference Call Recap. To sign up, choose either the monthly or annual checkout link below:
Chart of the Day – Q2 Earnings Trends and Potential Turnarounds
Bespoke’s Morning Lineup – 7/22/25 – Streaks
See what’s driving market performance around the world in today’s Morning Lineup. Bespoke’s Morning Lineup is the best way to start your trading day. Read it now by starting a two-week trial to Bespoke Premium. CLICK HERE to learn more and start your trial.
“My buddies wanted to be firemen, farmers or policemen, something like that. Not me, I just wanted to steal people’s money!” – John Dillinger

Below is a snippet of commentary from today’s Morning Lineup. Start a two-week trial to Bespoke Premium to view the full report.
There’s a negative bias in equity futures this morning as investors digest what has been a monster run, especially in some of the more speculative areas of the market. You can’t fault investors for taking a step back to catch their breath as earnings season picks up and we approach the August 1st tariff deadlines. Treasury Secretary Scott Bessent stated in an interview this morning that August 1st is a firm deadline, after which tariff rates will revert to the April levels for any country where a deal has not been reached. Once again, the Treasury Secretary is promising lots of deals, but so far, there has been little substance.
European stocks are also weak again this morning, with the STOXX 600 down 0.6% with Germany leading the way lower with a decline of 1%. In Asia, equities had a more mixed showing with Japan down fractionally (after being closed yesterday) while China finished about 0.5% higher.
We’re in the second full week of earnings season, but the first of the big guns will kick things off tomorrow when Alphabet (GOOGL) and Tesla (TSLA) report after the close. In TSLA’s case, the stock is down nearly 20% on the year and closed yesterday just barely above its 50-day moving average, so expectations for the stock are pretty low. GOOGL is a bit of a different story. Of the now nine stocks with trillion-dollar market caps (a trillion isn’t what it used to be!), GOOGL is the only one trading at ‘extreme’ overbought (2+ standard deviations above its 50-DMA) levels, so on a short-term basis, expectations for the stock are on the high side. Longer-term, however, GOOGL has been an underperformer this year, with just a fractional gain, making it the third-worst performer of the “Noble Nine”.
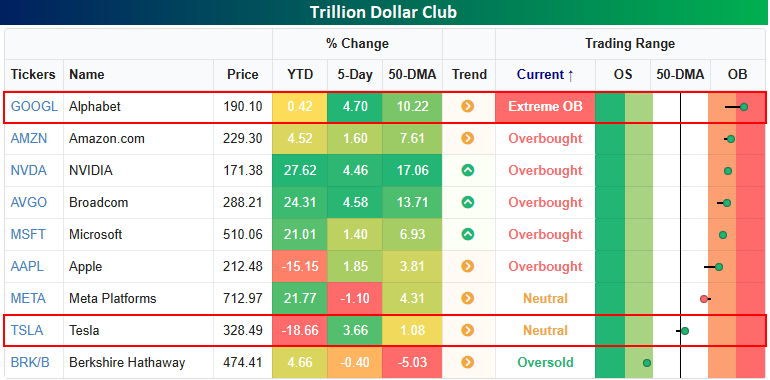
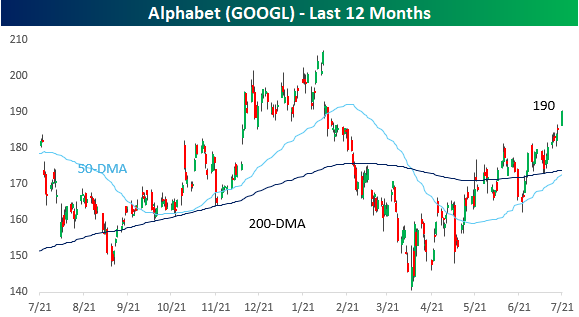
Looking specifically at GOOGL, even with the stock trading at extreme overbought levels, it remains right in the middle of the range it has occupied for the last year, with a low end just below $150 and a high end at just above $200. While GOOGL was the first mega-cap to brand itself as an AI-first company, the stock has been a battleground between those who say it missed the boat on AI and those who say it’s just taking its time.
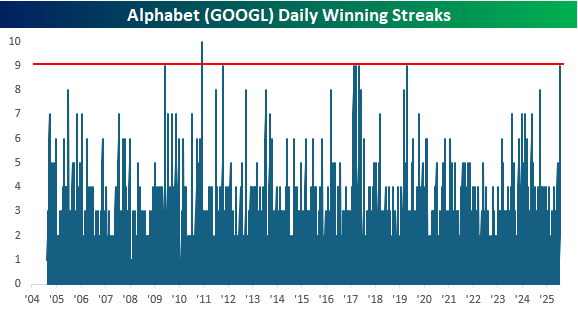
Besides closing at extreme overbought levels yesterday, GOOGL also finished the day higher for the ninth day in a row. That’s just one day shy of the longest streak in the stock’s history since its IPO in 2004 and the longest winning streak in more than six years.
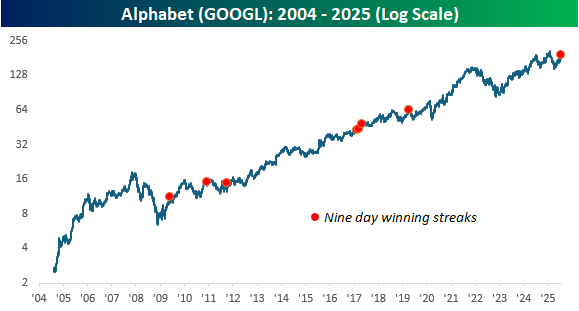
The chart below shows the long-term performance of GOOGL with each red dot indicating a 9-day winning streak. While none of these streaks occurred at or near a long-term peak in the stock (there haven’t been many), many occurred near a short-term peak.
The Closer – Dollar Bad Day, Option Led Optimism – 7/21/25
Log-in here if you’re a member with access to the Closer.
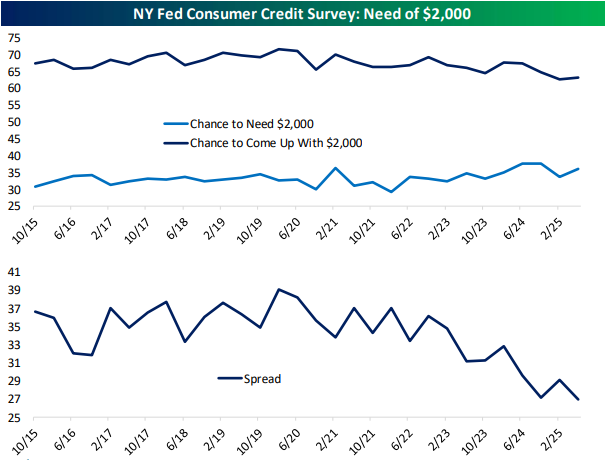
Looking for deeper insight into markets? In tonight’s Closer sent to Bespoke Institutional clients, we start with a look at the moves in the US dollar (page 1) followed by a checkup on options volumes (page 2). After reviewing some big swings in futures positioning (page 3) we finish tonight’s report with a rundown into consumer credit survey data out of the New York Fed (pages 4 and 5).
See today’s full post-market Closer and everything else Bespoke publishes by starting a 14-day trial to Bespoke Institutional today!
Daily Sector Snapshot — 7/21/25
Q2 2025 Earnings Conference Call Recaps: Domino’s Pizza (DPZ)
Bespoke’s Conference Call Recaps use AI to summarize lengthy earnings calls. The commentary below is AI-generated and then edited by Bespoke for quality control. As always, none of these summaries should be construed as recommendations to buy or sell any securities, and investors should do their own research and/or consult with a financial professional before making any investment decisions.
Our latest recap available to Bespoke subscribers covers Domino’s Pizza (DPZ) Q2 2025 earnings call.
![]()
Domino’s Pizza (DPZ) is the largest pizza company in the world by global retail sales, operating a heavily franchised model across more than 90 markets. Known for its delivery and carryout focus, the company produces and sells a range of pizzas, pastas, chicken, and side items through its extensive store network. Domino’s is a case study in digital transformation within QSR, with over 85% of US orders placed digitally and a global supply chain that supports consistent execution. Domino’s delivered 3.4% US same-store sales growth in Q2, driven by strong traction from the launch of Parmesan-Stuffed Crust, its most complex product yet. The company completed its nationwide rollout on DoorDash and expects it to be a meaningful comp driver in the second half of the year, joining Uber Eats to round out its aggregator strategy. Carryout growth hit a record 5.8%, boosted by its revamped Domino’s Rewards program. Executives emphasized Domino’s positioning to win on value during a pressured consumer backdrop. Global net store growth totaled 178, including 30 in the US, with strong performance in India and Canada helping offset macro risks abroad. DPZ shares opened 4.5% higher on 7/21, but gains were completely wiped out intraday after missing estimates on the top and bottom lines…
Continue reading our Conference Call Recap for DPZ by becoming a Bespoke Institutional subscriber. You can sign up for Bespoke Institutional now and receive a 14-day trial to read our newest Conference Call Recap. To sign up, choose either the monthly or annual checkout link below:
Q2 2025 Earnings Conference Call Recaps: American Express (AXP)
Bespoke’s Conference Call Recaps use AI to summarize lengthy earnings calls. The commentary below is AI-generated and then edited by Bespoke for quality control. As always, none of these summaries should be construed as recommendations to buy or sell any securities, and investors should do their own research and/or consult with a financial professional before making any investment decisions.
Our latest recap available to Bespoke subscribers covers American Express’ (AXP) Q2 2025 earnings call.
![]()
American Express (AXP) is a global payments company best known for its premium charge and credit cards, financial services, and travel-related offerings. It issues cards, operates a proprietary merchant network, and earns revenue from both card fees and discount rates on transactions. The company gives unique insight into discretionary consumer spending, especially among younger, high-income, and international segments. AXP reported record revenue of $17.9B (+9% YoY) and EPS of $4.08 (+17% YoY ex-Accertify). Gen-Z and Millennial spend surged 40% and 10% respectively, and transaction growth held strong at +9%. Despite softening in airline and lodging categories, overall cardmember spend remained resilient. The upcoming US Platinum card refresh was a major theme, with AXP reaffirming its leadership in the premium space and defending its pricing power amid rising competition. The company also discussed exiting its Amazon and Lowe’s co-brand portfolios, double-digit international growth, and early moves in digital currency through a new Coinbase partnership. The stock declined 2.4% on 7/18 despite better-than-expected results…
Continue reading our Conference Call Recap for AXP by becoming a Bespoke Institutional subscriber. You can sign up for Bespoke Institutional now and receive a 14-day trial to read our newest Conference Call Recap. To sign up, choose either the monthly or annual checkout link below:
Another 1,000 Point Level Bites the Dust
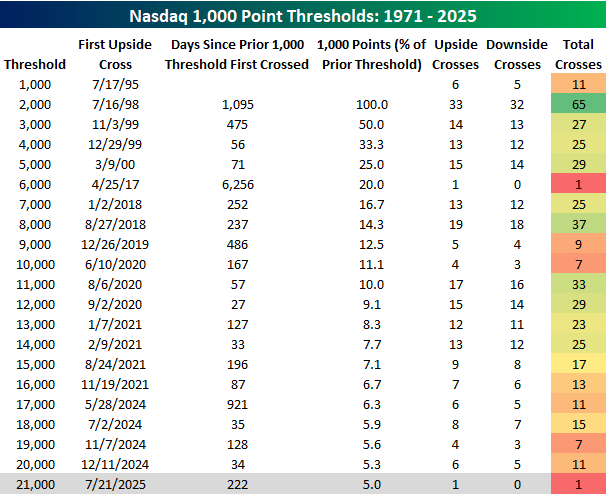
For the first time this year but the third time since the 2024 election, the Nasdaq Composite is on the cusp of closing above another 1,000-point threshold as the index crossed 21,000 for the first time earlier today. In the table below, we list the date that the Nasdaq first closed above each 1,000-point threshold since first closing above four-digit territory 30 years ago in July 1995.
After first closing above 1,000 in July 1995, it took another three years for the Nasdaq to breach the 2,000 level, but 1,000 points for the Nasdaq isn’t what it used to be. Back then, the Nasdaq had to double to get from 1,000 to 2,000, but the latest 1,000 points required a gain of just 5%.
Of all the different 1,000-point thresholds, the only one the Nasdaq crossed and never looked back from was 6,000 in April 2017. That was also the 1,000-point threshold with the longest span between crosses as it took more than 17 years to get there. At the other extreme, the 1,000-point threshold with the most crosses was 2,000 with 65, while the shortest span between different 1,000-point levels was the 27 days it took to cross from 11,000 to 12,000 in the summer of 2020.
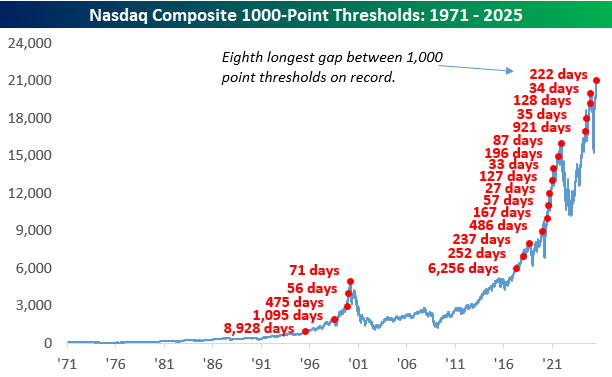
The long-term chart of the Nasdaq below shows when each 1,000-point threshold was first crossed along with the number of days between each one. After a period of 921 days without a new 1,000 point threshold, since the Nasdaq first closed above 17,000, it has crossed a new level four more times.
As mentioned above, 1,000 points isn’t what it used to be, and the Nasdaq’s price history on a log scale illustrates that as each 1,000-point level is more closely bunched together as the index rises over time. After requiring a rally of 100% to get from 1,000 to 2,000, it now takes a rally of less than 5% (and even less with each successive level reached) to reach a new 1,000 point threshold.
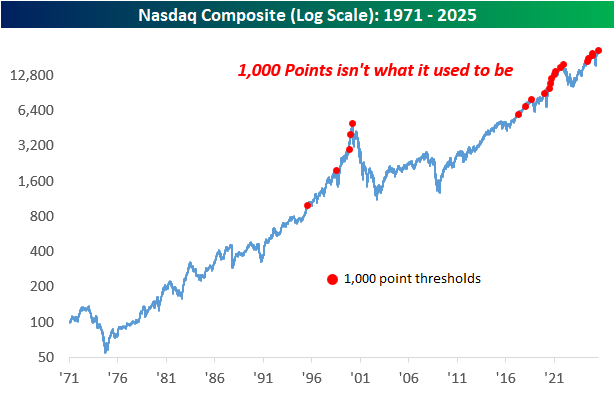

Chart of the Day: Trump Two-Step…But Not Because of Trump
Q2 2025 Earnings Conference Call Recaps: 3M (MMM)
Bespoke’s Conference Call Recaps use AI to summarize lengthy earnings calls. The commentary below is AI-generated and then edited by Bespoke for quality control. As always, none of these summaries should be construed as recommendations to buy or sell any securities, and investors should do their own research and/or consult with a financial professional before making any investment decisions.
Our latest recap available to Bespoke subscribers covers 3M’s (MMM) Q2 2025 earnings call.

3M is a global industrial and technology company known for its diversified portfolio spanning over 60,000 products across safety, healthcare, consumer goods, electronics, and manufacturing. It serves a range of customers, from hospitals and governments to contractors and big-box retailers, offering everything from adhesives and abrasives to air filtration and medical tapes. What makes 3M impressive is its relentless focus on applied science and operational scale, launching 126 new products in the first half of 2025 alone. The company provides unique insights into global industrial trends, supply chain dynamics, and innovation-led margin expansion. 3M delivered strong Q2 results, with adjusted EPS of $2.16 (+12% YoY) and free cash flow of $1.3B. Key drivers included a 70% YoY increase in product launches (64 in Q2), expansion of a global commercial excellence initiative, and operational improvements. The macro backdrop remains “sluggish,” but 3M sees momentum from internal execution, particularly in industrial, auto, and electrical markets. Tariff impacts are now baked into guidance, offset by pricing power and sourcing changes. Full-year EPS guidance was raised to $7.75–$8.00, with margin expansion and >100% free cash flow conversion expected. In reaction to earnings on 7/18, shares of MMM traded down 3.7%…
Continue reading our Conference Call Recap for MMM by becoming a Bespoke Institutional subscriber. You can sign up for Bespoke Institutional now and receive a 14-day trial to read our newest Conference Call Recap. To sign up, choose either the monthly or annual checkout link below: