Bespoke’s Sector Snapshot — 9/27/18
Chart of the Day: Mosaic (MOS)
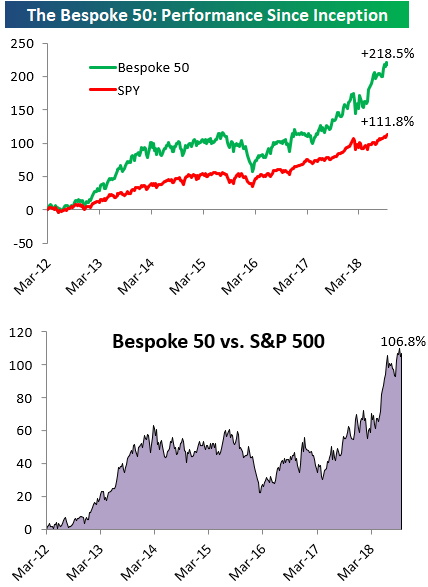
the Bespoke 50 — 9/27/18
Every Thursday, Bespoke publishes its “Bespoke 50” list of top growth stocks in the Russell 3,000. Our “Bespoke 50” portfolio is made up of the 50 stocks that fit a proprietary growth screen that we created a number of years ago. Since inception in early 2012, the “Bespoke 50” has beaten the S&P 500 by 106.8 percentage points. Through today, the “Bespoke 50” is up 218.5% since inception versus the S&P 500’s gain of 111.8%. Always remember, though, that past performance is no guarantee of future returns.
To view our “Bespoke 50” list of top growth stocks, click the button below and start a trial to either Bespoke Premium or Bespoke Institutional.
Individual Investors Turn a Bit More Bullish
With the Dow Jones – America’s “Main Street” equity index – joining the S&P at new highs to close out last week, we were not too surprised to see that individual investors turned more bullish in the latest week. But even after the increase, positive sentiment remains at extremely depressed levels given what the market has done recently. According to the weekly survey from AAII, bullish sentiment rose from 32.04% up to 36.22%. That’s still below the average reading of 36.7% for the current bull market.
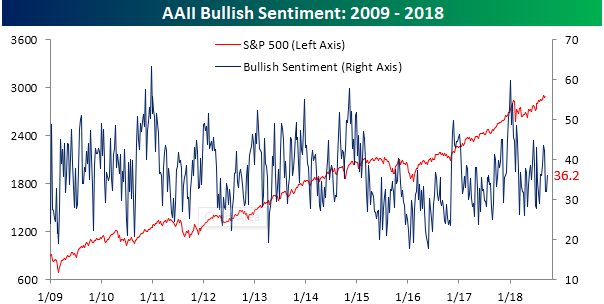
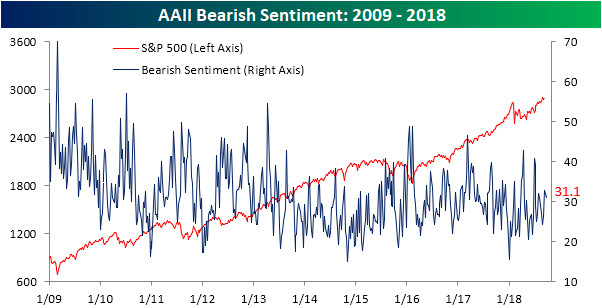
Even with the increase in bullish sentiment, bearish sentiment barely declined, falling less than one percentage point from 32.0% down to 31.1%.
The main source for the increase in bullish sentiment came from the ‘fence-sitters’ as neutral sentiment declined from 35.9% down to 32.7%.

Jobless Claims Rise More Than Expected
Before we go any further this morning, we hope you’re sitting down for this one because it’s a shocker. OK, are you ready for it? Here it goes. This week’s report on initial jobless claims was actually a bit disappointing. While economists were expecting claims to tick up to 210K, the actual reading came in at 214K. This week’s increase represents the largest one week rise in claims since May and put the actual reading at the highest level in a month. Even with the ‘disappointing’ report this morning, this week’s claims number represents the 186th straight week where claims were at or below 300K, the 51st straight week where claims were at or below 250K (longest streak since 1970), and the 12th week where claims were at or below 225K. So even a disappointing report wasn’t all that bad in the grand scheme of things.
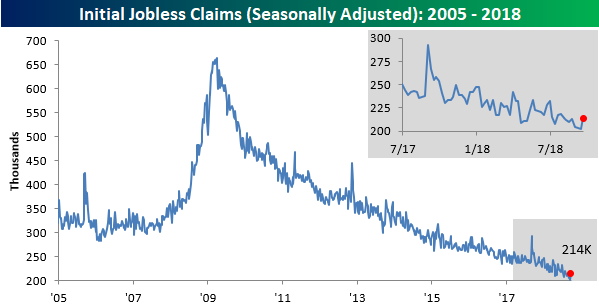
Although claims rose by 12K this week, the four-week moving average only rose by 250 to 206.25K, so that’s still right near the multi-decade low that was reached last week.

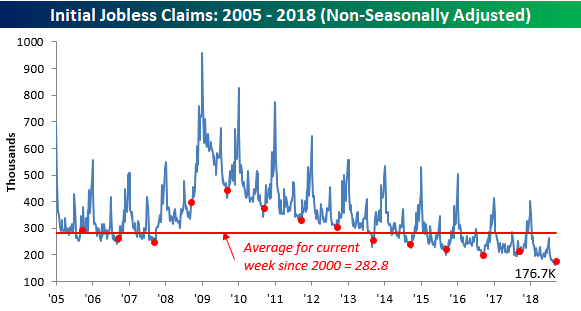
Finally, on a non-seasonally adjusted basis, jobless claims rose from 169.2K up to 176.7K. Even with the increase, though, it’s the lowest reading for the current week of the year since 1969 and more than 100K below the average of 282.8K for the current week of the year dating back to 2000.
Morning Lineup – Get Ready For the Circus
US equity futures are slightly higher this morning as the markets try to recover from yesterday’s post-FOMC swoon, but things are really likely to quiet down shortly after the open this morning when the Kavanaugh hearing kicks off at 10 AM.
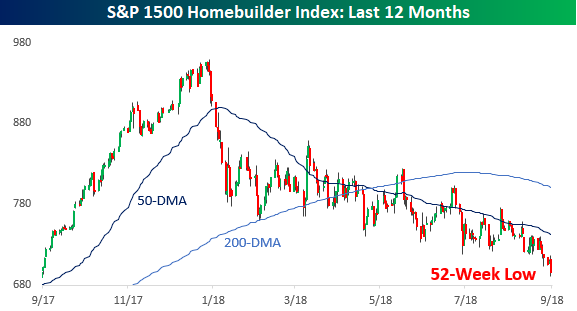
While the broader market continues to trade right near all-time highs, a number of key areas of the market are not only missing out of the party, but they’re at 52-week lows. Exhibit A is the homebuilders (chart below), but along with them, stocks like Whirlpool (WHR), and Bed, Bath, and Beyond (BBY) are also at multi-year lows, while the two ‘generals’ of General Electric (GE) and General Motors (GM) are acting more like ‘privates’.
It’s still earnings off-season, but from the few reports we have seen so far, companies aren’t exactly wowing investors. We first highlighted this in last week’s Bespoke Report, but this week we are seeing the trend continue a bit as just over half of companies reporting managed to exceed their revenue forecasts. Once earnings season comes, they are going to have to do better than that!
Start a two-week free trial to Bespoke Premium to see today’s full Morning Lineup report. You’ll receive it in your inbox each morning an hour before the open to get your trading day started.

Trend Analyzer – 9/27/18 – Nasdaq is the Sole Survivor
In reaction to the Fed hiking rates yesterday, equity markets fell with some areas seeing greater declines than others. Every major US Index ETF has moved below where it stood this time last week, with the exception being the Nasdaq 100 (QQQ). Up the most YTD of all these indices, it almost should not come as a surprise that it has withstood the hit of the Fed Day, still up 1.04% over the past 5 trading days. It was also the only ETF of this group to have seen any gains at all at the close. Every other major US Index ETF was down on the day. QQQ, along with the Dow (DIA), is the only remaining overbought ETF. All others have moved to neutral.

The Closer — Fed Hikes, Banks & Builders Falter — 9/26/18
Log-in here if you’re a member with access to the Closer.
Looking for deeper insight on markets? In tonight’s Closer sent to Bespoke Institutional clients, we recap the Fed decision today before diving into the collapse of bank stocks, new home sales data, and the decline in homebuilder stocks. We also recap EIA petroleum market data along with recent Energy price action.

See today’s post-market Closer and everything else Bespoke publishes by starting a 14-day free trial to Bespoke Institutional today!
Homebuilders Continue to Break Down
While the S&P 500 didn’t go negative until the end of the trading day following the Fed’s rate hike, the homebuilder stocks were down on the day much earlier.
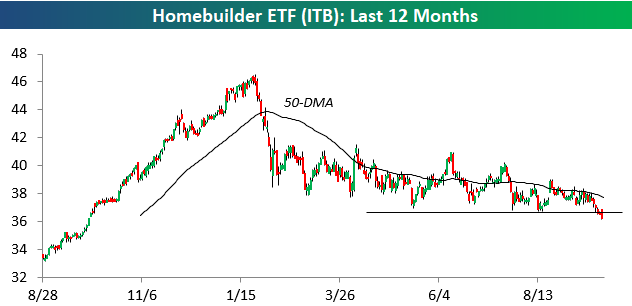
After initially gapping higher at the open following what appeared to be a strong earnings report, KB Homes (KBH) quickly reversed its gains to trade lower by 3% in morning trading. The reversal lower from KBH sent the entire homebuilder group into the red, and as shown below, the homebuilder ETF (ITB) went on to make a new 52-week low today.
As the broad US market and most sectors have traded to new highs lately, the homebuilders have been trading terribly. A month ago, we saw Toll Brothers (TOL) trade positively in reaction to earnings only to give nearly all of it back over the last few weeks. Today we saw KBH initially trade higher on earnings before sellers quickly started hitting bids. Investors can’t seem to get out of the group quick enough lately.
Below is a chart comparing US Housing Starts to the homebuilder stocks going back to 2006. As you can see, prior to 2017, the two tracked each other extremely closely. Last year, though, the homebuilder stocks diverged from Starts by going on an epic run higher. Starts just couldn’t keep up.
So far in 2018, Starts have continued to trade sideways, so it appears as though the homebuilder stocks simply got ahead of themselves last year and are now mean reverting to get more in line with the historical relationship.

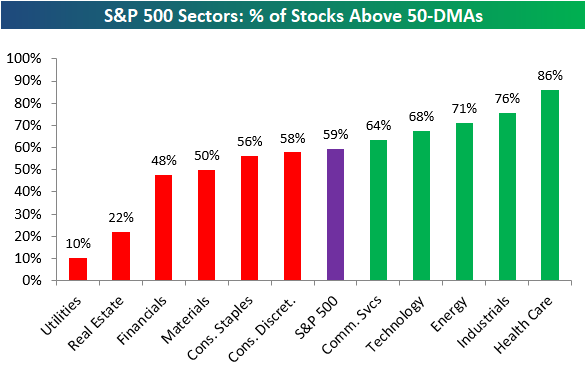
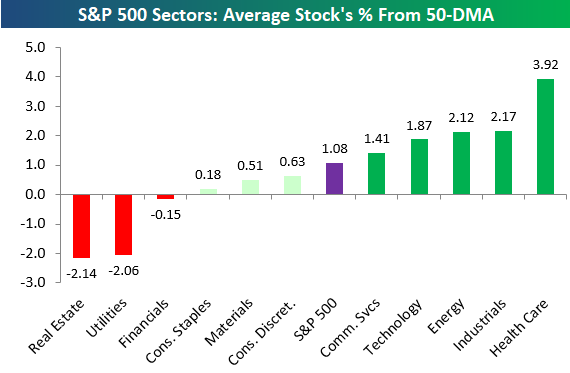
New S&P 500 Sector Breadth Levels
Below is a look at the average stock’s distance from its 50-day moving average using the new GICS sector re-classifications that were made earlier this week. As shown, the average stock in the broad S&P 500 is 1.08% above its 50-day moving average, while Health Care stocks are the most extended at +3.92%. Four other sectors have readings above the overall average — Industrials, Energy, Technology, and the new Communication Services sector.
On the downside, there are three sectors with negative readings. The average Real Estate stock is 2.14% below its 50-DMA, which is the weakest of any sector. Utilities and Financials are the two other sectors in the red.
In terms of breadth, 59% of S&P 500 stocks are above their 50-day moving averages, and five sectors have stronger readings than that — Health Care (86%), Industrials (76%), Energy (71%), Technology (68%), and Communication Services (64%).
Just 10% of Utilities stocks are above their 50-day moving averages, which is by far the weakest breadth reading of any sector. Financials and Real Estate are the only other sectors with readings below 50%.
For Bespoke’s in-depth sector analysis, start a two-week free trial to Bespoke Premium.