Bespoke Summary of Economic Indicators: 10/1/18
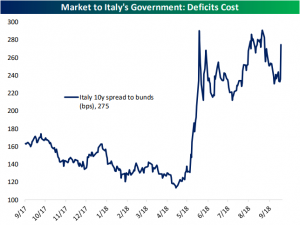
Italy’s Budget Woes
European equities ended last week by unwinding two weeks worth of solid gains. On Friday, the STOXX 600 was down 0.83% on very high volumes, but the real chaos was in Italy where the FTSE MIB was down 3.7%. Within the STOXX 600, Banks felt the pain the most, down 2.8% with Insurance not far behind at 1.7%. Italian banks made up four of the worst five performers in the broad STOXX 600, with Banco BPM, Unione di Banche Italia, UniCredit, and Intesa Sanpaolo all off at least 7.8%. The FTSE MIB saw a continuation of these issues today, falling 0.49% on the session.

The reason for all the chaos was the Italian government destroying market hopes of fiscal restraint. Thursday night, they announced a deficit-to-GDP target for the 2019 budget of 2.4% of GDP. Italian government debt-to-GDP is 132%, and its economic indicators consistently lag; there’s just no way they can sustainably spend 2+% of GDP if the markets don’t want to let them. Eurozone officials echoed these concerns in a meeting earlier today and look to mitigate escalation of these concerns.

While much has been made of the Italy-EU fault lines, this market-imposed discipline is much more binding at present and saves much of the work that EU bodies might otherwise have to do in restraining Italian spending.
Oil Breaks Out to New 52-Week High
The price of crude oil is breaking out today as shown in the chart below. At $74.73/barrel, crude is now at its highest level in nearly four years.
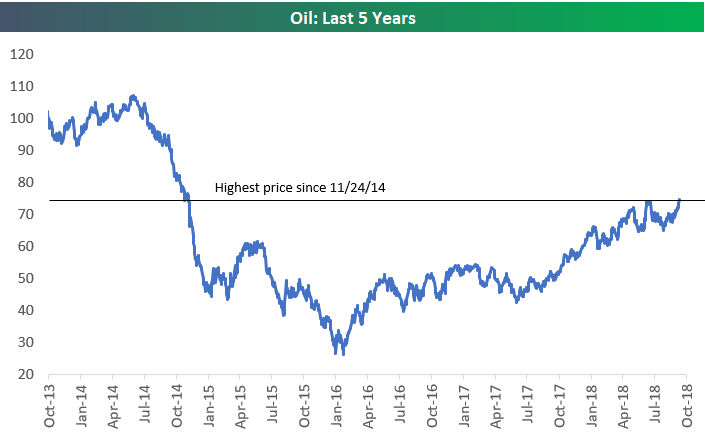
While the five-year chart above looks relatively constructive, an even longer term chart going back to 1990 looks more daunting for oil bulls. For the chart below to turn more bullish from a technical perspective, we’d want to see price move above resistance near $110.


Bespoke Market Calendar — October 2018
Please click the image below to view our October 2018 market calendar. This calendar includes the S&P 500’s average percentage change and average intraday chart pattern for each trading day during the upcoming month. It also includes market holidays and options expiration dates plus the dates of key economic indicator releases.


This Week’s Economic Indicators
We are kicking off October with a relatively light few days on the economic data front. Overnight, Manufacturing and Service PMIs were released alongside Retail Sales for multiple countries including Germany, Italy, Switzerland, France, and the UK. Japan’s quarterly Tankan business surveys were updated with most series missing expectations.
Back home this morning, the US Manufacturing PMI for September came in right inline with expectations. ISM Manufacturing and Prices Paid were released shortly after and both came in below expectations. After no releases tomorrow, Wednesday will round out the ISM and PMI releases with the services portion of both indicators.
On Friday, we will see if the labor market continues its hot streak when Nonfarm Payrolls for September hits the tape. Payrolls and U3 unemployment are estimated to decline once again while hours are expected to go unchanged. Average hourly earnings are predicted to see a slight downtick in YoY growth. See the table below for the rest of the upcoming US data releases this week. You can always check out the day’s economic releases here with our Economic Monitor.

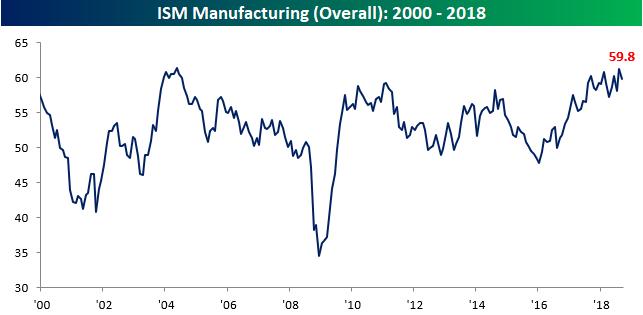
ISM Manufacturing Drops More Than Expected
After surging to a multi-year high in August, the ISM Manufacturing index pulled back slightly more than expected in September, falling from 61.3 down to 59.8 versus expectations for a drop to 60.0. As shown in the chart, though, activity is still at extremely robust levels.
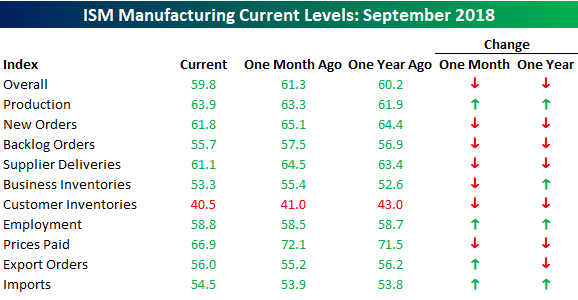
In terms of the commentary of this month’s report, it was generally positive, but that strength is being clouded by the issue of tariffs, which is showing up in a number of sectors like Computer and Electronic Products, Chemicals, Furniture, and Plastics.

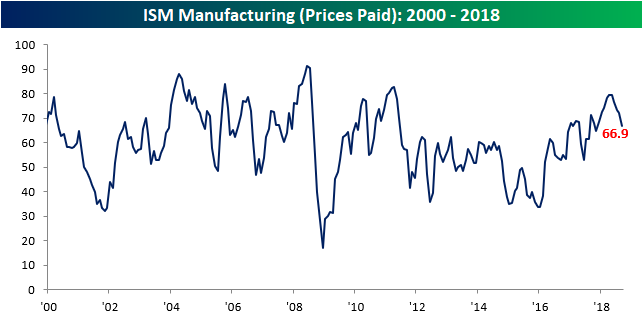
As far as the breakdown of this month’s report is concerned, breadth was relatively weak. On a m/m basis, just four categories improved while six declined. Production was one bright spot, as were Export and Import Orders, which is a bit surprising given the recent barriers to trade. The only other category to show a m/m increase was Employment. On the downside, the most notable decline was Prices Paid. That index dropped from 72.1 down to 66.9 which is the lowest monthly reading of the year and largest m/m decline since last June. Here again, one would expect the increasingly tense trade environment to be having upward rather than downward pressure on prices.
It’s the Most…Wonderful Time…of the Year
From a seasonal perspective, investors have now cleared what has historically been the worst month of the year for the US equity market (September), and we now enter what is normally the best stretch of the year.
Below is this morning’s snapshot from our interactive Price Database, which shows the median change of the S&P 500 over the next week, month, and 3 months based on the last 10 years worth of price action. Bespoke’s Price Database is available for use by Bespoke Premium and Bespoke Institutional members, and it’s just one of many unique investment tools at their disposal for daily use.
There is green lighting up our gauges! Over the next week (10/1-10/8), the S&P 500 has seen a median gain of 1.18% based on the last 10 years worth of price action. Over the next month, the median change has been +2.72%, and over the next 3 months (10/1-12/31), the gain has been +7.07% The 3-month return of +7.07% represents “Perfect” seasonals, meaning it’s the best stretch of the calendar year compared to all other 3-month periods.

Chart of the Day – S&P 500 Six Month Winning Streaks
Trend Analyzer – 10/1/18 – September’s Ugly End
September had a rough final week as US equities fell after further trade tensions and other political news. You can see this through this morning’s Trend Analyzer snapshot. Six ETFs are overbought, 8 are neutral, and none are oversold. Except for the Nasdaq 100 (QQQ), every one of the major US Index ETFs is down from where they were this time last week with long tails moving out of overbought territory. Fortunately, October seems to be starting off on the right foot with news coming out this morning that Canada will be joining in on the NAFTA replacement deal. Stocks are set to open higher following this news.

Morning Lineup – Analysts Still Hate the Semis
The opening bell hasn’t even rung yet, but already Q4 is looking to pick up right where Q3 left off with futures indicating a strong start to the week, month, and final quarter of 2018. Obviously, the big catalyst this morning is the announced trade deal the US has reached with Canada to join the US-Mexico trade agreement.
Another area where Q4 is picking up right where Q3 left off is in analyst sentiment towards the semis. As shown in our “Analyst Actions” section of the Morning Lineup, there’s been a number of downgrades of semiconductor stocks this morning with Morgan Stanley downgrading Intel (INTC), Baird cutting AMD, and both Mizuho and Deutsche Bank cutting Lam Research (LRCX).
The negative sentiment towards the semis is really nothing new at this point. Intel, for example, is down 17% from its highs. Short interest levels also show that negative bets towards the semis have been building for some time. As the most recent data (through mid-September) illustrates, the average short interest as a percentage of float for stocks in the semiconductor group is at the highest levels since October 2014!

Start a two-week free trial to Bespoke Premium to see today’s full Morning Lineup report. You’ll receive it in your inbox each morning an hour before the open to get your trading day started.
