Empire Manufacturing Tops Expectations
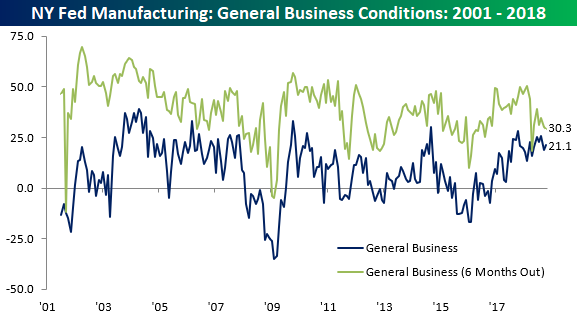
The Empire Manufacturing report put out by the New York Fed came in slightly stronger than expected in October, rising to a level of 21.1 from 19.0 and expectations for an increase to 20.0. The headline index for this report has now been positive for 24 straight months, which is the longest streak of positive readings since the 32-month streak that ended in January 2008. While the index of current General Business conditions rebounded this month, expectations pulled back for the second straight month.
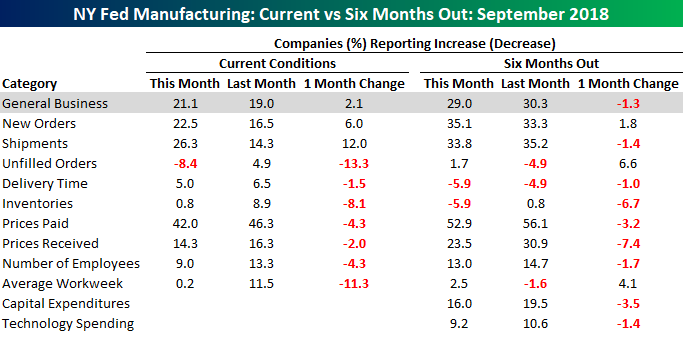
The internals of this month’s report were generally weak. In terms of current conditions, both New Orders and Shipments saw increases, but every other component declined including both Prices Paid and Prices Received as well as Number of Employees and Average Workweek. The outlook for Manufacturers was also skewed to the downside. While New Orders saw a slight increase, Shipments actually declined.
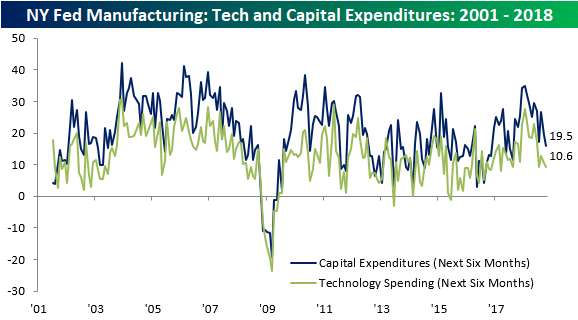
Another not so positive aspect of the October Empire Manufacturing report was the section about plans for Cap Ex and Technology Spending. Both of these indices declined in October. In the case of Cap Ex, that index dropped to its lowest level since August 2017, while the index for expected Technology Spending dropped to its lowest level since March 2017.
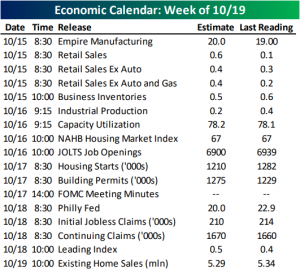
This Week’s Economic Indicators – 10/15/18
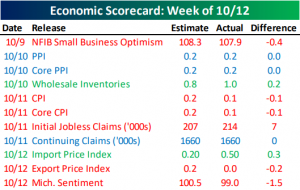
Not that there was much of it, but economic data took a backseat last week as investors were understandably more concerned with their portfolios. Regardless, there were some important reports, most of which did not meet expectations.
Inflation data—PPI on Tuesday, CPI on Wednesday, and Import/Export Prices on Friday—was the main focus point of the week. Of these reports three were weaker than expected, two were inline, and only one beat expectations. Small business optimism came in weaker and lower than expectations, but should not be a cause for concern as it still sits at above average levels. Jobless claims was a similar story. Even though it came in with a rare weaker reading, it is still at healthy levels.
This week things get a little bit busier with 17 US releases scheduled. Retail Sales for September kicked off the week earlier today slightly worse than forecasted. Sales grew, but just barely so. Fortunately, the core measure did beat estimates and the previous reading. Business Inventories also released this morning inline with estimates.
Looking towards the rest of this week, the main focus will center around housing. The National Association of Home Builders Housing Market Index releases tomorrow followed by Housing Starts and Building Permits on Wednesday. Existing Home Sales will close out the week on Friday morning. Also on the docket is the JOLTS report tomorrow and the Philly Fed Manufacturing Index and Leading Index on Thursday.
As always, you can find the day’s economic releases in our Economic Monitor.
B.I.G. Tips – Retail Sales: Six September Misses in a Row
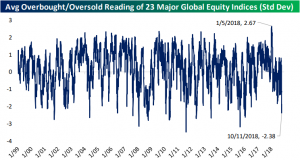
The US Not Alone In Being Oversold
It is no secret that the US has become extremely oversold in the past week, but this weakness extends well outside of our own borders. With the worst of the selloff occurring last Thursday, declines were widespread and extreme. The table below shows the Overbought and Oversold readings of global equity benchmarks for the 23 countries from our Global Macro Dashboard. Of the group shown in the table, the average Overbought/Oversold reading as of the close Thursday was 2.38 standard deviations below their 50-DMA. A majority were even more than this average as seven of these countries had readings below negative three standard deviations.
Relative to their daily price action over the past two years, Thursday’s collapse was even more remarkable. The 23 countries shown were all down with an average move of 2.73 standard deviations for the day. Taiwan led this average down an astounding 7.58 standard deviations. There is no way to sugar coat how bad Thursday was for global equities.
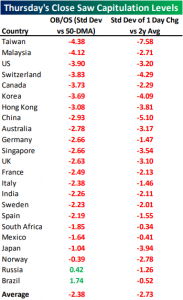
With a longer time horizon, Thursday’s move was not the worst in the past 20 years. There have been sessions in which global equities collectively closed at more oversold levels. Thursday was the worst since January 2016 when global markets were trying to cope with the FOMC’s first rate hike following zero interest rate policy. Also worth noting is that many of these equity benchmarks are coming from a different place than the US. US equity markets are coming off of very recent bull market highs, conversely, the rest of the world has been trending lower.
Morning Lineup – Coming Back
We’ve seen a valiant effort by the bulls to bring US equity futures back into the black after some moderate declines earlier this morning, but the just-released September Retail Sales report isn’t helping matters as the headline reading came in weaker than expected (+0.1% act vs +0.6% exp). Ex Autos, the September reading was even weaker showing a decline of 0.1%, which was the weakest monthly reading since May 2017.
As we enter a new trading week, we just wanted to provide a brief synopsis of where stocks in various sectors and market cap ranges stand relative to their 52-week highs. The table below shows the percentage of stocks in each sector (grouped by market cap) that are down 10% and 20% from their 52-week highs. For the S&P 500 as a whole, 69% of stocks are down an at least 10% from their highs, while 30% are down over 20%. The numbers for small caps are even worse with 86.6% down more than 10% and over half down 20%+.

Start a two-week free trial to Bespoke Premium to see today’s full Morning Lineup report. You’ll receive it in your inbox each morning an hour before the open to get your trading day started.

Bespoke Brunch Reads: 10/14/18
Welcome to Bespoke Brunch Reads — a linkfest of the favorite things we read over the past week. The links are mostly market related, but there are some other interesting subjects covered as well. We hope you enjoy the food for thought as a supplement to the research we provide you during the week.
Social Studies
The Little College Where Tuition Is Free and Every Student Is Given a Job by Adam Harris (The Atlantic)
A Kentucky college founded by an abolitionist Presbyterian minister in 1855 (and also the first co-educational, racially integrated) has no tuition. Every student works, on tasks from janitorial services to academic instruction. 45% of its students have no debt, despite 90% being Pell Grant-eligible. [Link]
Anti-social Punishment by Martin Sustrik (Less Wrong)
This article summarizes a study that shows how people across different cultures respond to collective action failures. Most interestingly, they identify cultures where defectors (using the language of game theory) who are punished for “anti-social” behavior punish back, effectively negating the social benefits of punishment. [Link]
The History of Philosophy: Summarized & Visualized (Deniz Cem Önduygu)
A fantastic chronological summary of the major ideas developed by Western philosophers, including ties which show who disagreed or agreed with whom over time. [Link]
Politics
Trump Says Blame ‘Loco’ Fed, Not China Trade War, for Sell-Off by Justin Sink and Shannon Pettypiece (Bloomberg)
In a relatively uncommon – but hardly unprecedented – discussion of Fed policy by a sitting President, Trump attacked the interest rate normalization policy of the Federal Reserve. [Link; soft paywall]
As feds focused on detaining kids, border drug prosecutions plummeted by Brad Heath (USAToday)
Resources are fungible, so a pivot by DoJ to focus on the lowest-level immigration offenses has led to a collapse in the number of prosecutions brought against drug traffickers. [Link]
Beto O’Rourke May Benefit From an Unlikely Support Group: White Evangelical Women by Elizabeth Dias (NYT)
While polling for the Texas Senate race is only sort of close, Democrat Beto O’Rourke may be finding success in breaking off a small slice of the solidly Republican Evangelical voting block. [Link; soft paywall]
Tech
These Magical Sunglasses Block All The Screens Around You by Arielle Pardes (Wired)
Perfect for folks who want to escape the never-ending rush of digital imposition, these new glasses block the light thrown off by screens. [Link; soft paywall]
Global Supply Chains
You buy a purse at Walmart. There’s a note inside from a “Chinese prisoner.” Now what? by Rossalyn A. Warren (Vox)
An investigation of a note found in a purse bought from Wal-Mart that reveals some of the hard truths of global consumer goods manufacturing: labor used to make clothes, electronics, and other goods is not always willingly provided. [Link]
Capital Flows
Reflections On A Decade of Private Cross-Border Acquisitions of U.S. Debt by stwill1 (Concentrated Ambiguity)
A massive set of posts devoted to understanding the current state of US fixed income buying by investors abroad. [Link]
Astronomy
Moons can have moons and they are called moonmoons by Leah Crane (New Scientist)
While we haven’t actually observed a moon with a moon of its own, astronomers have already decided the name for such a body is the adorable if somewhat uncreative “moonmoon”. [Link; soft paywall]
History
Today (maybe) in European history: the Battle of Tours (probably 732) by Derek Davidson (And That’s The Way It Was)
An excellent review of the historical evidence – surprisingly scanty – related to the battle which some historians believe prevented further Muslim expansion in Western Europe beyond the Ummayyad Caliphate in El Andalus. [Link]
Implicit Bias
Amazon scraps secret AI recruiting tool that showed bias against women by Jeffrey Dastin (Reuters)
The biggest problem with algorithms isn’t their biases but the biases of people that design them and the data they are used to train on. In an excellent example of this phenomenon, Amazon recently scrapped a machine-learning tool used for recruiting that introduced biases against women. [Link]
Investing
Morgan Stanley: Belief in ‘American exceptionalism’ among global investors has never been higher by Michelle Fox (CNBC)
Investors are betting heavily on US outperformance, and to a degree that’s historically bullish on the prospects for US capital markets relative to the rest of the world’s. [Link]
Read Bespoke’s most actionable market research by starting a two-week free trial today! Get started here.
Have a great Sunday!
2018 Week 6
Week 5 Results: 5-8, Overall: 37-32 (53.6%)
Outside of financial markets, we’re also sports fans here at Bespoke. With new legal sports betting avenues now available across the US, we figured we’d have some fun and pick each NFL game versus the spread this season (as of Saturday evening). Let’s see how we do…on to Week 6.
We were 5-8 in week 5, bringing our overall record through 5 weeks to 37-32 (53.6%).
2018 NFL Week 6 Bespoke Picks:
Tampa Bay at Atlanta (-3): Tampa Bay +3
Pittsburgh at Cincinnati (-1.5): Pittsburgh +1.5
LA Chargers at Cleveland (-1): LA Chargers +1
Seattle (-2.5) at Oakland: Oakland +2.5
Chicago (-4) at Miami: Miami +4
Arizona at Minnesota (-10): Minnesota -10
Indianapolis at NY Jets (-1): Indianapolis +1
Carolina (-1) at Washington: Washington +1
Buffalo at Houston (-11): Buffalo +11
LA Rams (-7.5) at Denver: LA Rams -7.5
Jacksonville (-3) at Dallas: Dallas +3
Baltimore (-2.5) at Tennessee: Tennessee +2.5
Kansas City at New England (-3.5): Kansas City +3.5
San Francisco at Green Bay (-9.5): Green Bay -9.5
2018 NFL Week 5 Bespoke Results:
Tennessee (-5.5) at Buffalo: Tennessee -5.5 (Loss)
Miami at Cincinnati (-6): Cincinnati -6 (Win)
Baltimore (-3) at Cleveland: Baltimore -3 (Loss)
Green Bay at Detroit Even: Green Bay Even (Loss)
Jacksonville at Kansas City (-3): Kansas City -3 (Win)
Denver (-1) at NY Jets: NY Jets +1 (Win)
Atlanta at Pittsburgh (-3): Atlanta +3 (Loss)
NY Giants at Carolina (-6): NY Giants +6 (Win)
Oakland at LA Chargers (-5.5): Oakland +5.5 (Loss)
Minnesota at Philadelphia (-3): Minnesota +3 (Win)
Arizona at San Francisco (-3): San Francisco -3 (Loss)
LA Rams (-7.5) at Seattle: LA Rams -7.5 (Loss)
Dallas at Houston (-3): Dallas +3 (Push)
Washington at New Orleans (-7): Washington +7 (Loss)
The Bespoke Report — A Sell-Off of Global Proportions
Wow! That was pretty extreme. After the most severe sell program in the market since the ‘flash crash’ of 2010 sent US equities plunging for a second straight day, the S&P 500 finished at what can only be considered a ridiculously oversold level on Thursday at more than 3.7 standard deviations below its 50-day moving average. For reference, we consider 1-standard deviation below the 50-DMA to be oversold, and two standard deviations to be an ‘extreme’ oversold reading. We’ll let you use your own adjectives to describe a level nearly twice that. To put some perspective on that oversold reading, the last time the S&P 500 was more oversold was August 2015.
So, what now? There’s some good and bad news here, but only time will tell which one plays out. For some added insight, check out this week’s Bespoke Report.

We’ve just published our latest weekly Bespoke Report newsletter, which is available to subscribers across all three of our membership levels. Sign up here to read the report.
To get up to speed on our thoughts regarding the market’s direction going forward, choose any membership option and access this week’s full Bespoke Report newsletter after signing up! You won’t be disappointed. Some of the topics discussed in this week’s report include:
- Extreme Oversold Markets
- China Valuation
- Global Extremes
- Worst Sell Program Since the Flash Crash
- US or International
- Growth vs Value
- Economic Surprises on the Horizon
- Earnings Season Preview – What to Watch For
- Longest Streaks Above 200-DMA
- Market Breadth
- October Parallels
- The Importance of 9.9

The Closer: End of Week Charts — 10/12/18
Looking for deeper insight on global markets and economics? In tonight’s Closer sent to Bespoke clients, we recap weekly price action in major asset classes, update economic surprise index data for major economies, chart the weekly Commitment of Traders report from the CFTC, and provide our normal nightly update on ETF performance, volume and price movers, and the Bespoke Market Timing Model. We also take a look at the trend in various developed market FX markets.
Below is a snapshot from today’s Closer highlighting recent performance of G10 FX. If you’d like to see more, start a free trial below.

The Closer is one of our most popular reports, and you can sign up for a free trial below to see it!
See tonight’s Closer by starting a two-week free trial to Bespoke Institutional now!
U. of Michigan Consumer Sentiment Misses
Forecasts for the University of Michigan Consumer Sentiment predicted the preliminary October release to increase to 100.5 from last month’s 100.1. This morning’s release missed forecasts, falling to 99.0. While this is below previous levels, it is important to note that it is not a big drop in sentiment, nor is it low relative to recent years. Admittedly not by much, the 99 level is still above the average so far in 2018 of 98.5.
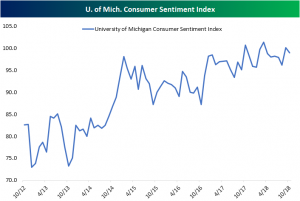
The release cited part of the reason for declining sentiment was rising inflation expectations for the next year. The chart below shows the inflation expectations for consumers that are interviewed in this survey. Consumers have had steep declines in near-term inflation expectations recently, but October’s preliminary report actually saw an increase to 2.8% from 2.7% for expectations for next year. For a longer time horizon of the next five years, expectations have fallen to 2.3%, the lowest level since December 2016 and joint-lowest of the cycle. In addition, the survey mentioned weaker real income expectations alongside declining household income growth as reasons for the weaker index number. An important matter to note concerning this release is the interviews conducted in the survey had only one night of overlap with the downturn in the markets over the past week. In other words, this preliminary release is not likely to account for any large change in sentiment from this event. When the final release comes on October 26th, we should be able to see what effect, if any, the past few days of market declines have had, and how inflation expectations pan out for the rest of the month.
